仪表盘
元素
-
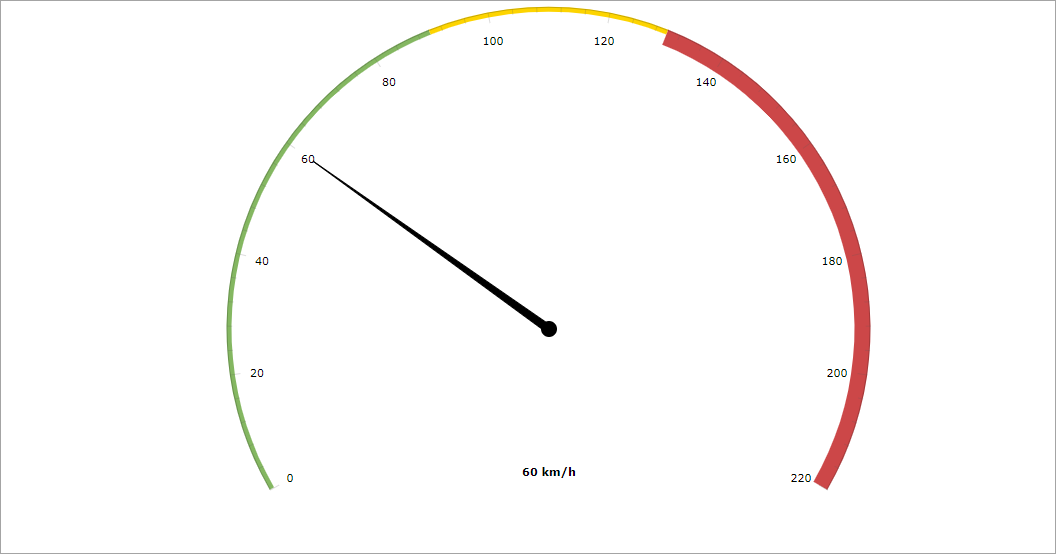
arrows- 包含内部的arrow元素,指定图表的指针轴。<chart:arrows> <chart:arrow value="60"/> </chart:arrows> -
axes- 包含内部的axis元素指定图表的坐标轴。<chart:axes> <chart:axis axisAlpha="0.2" axisThickness="1" bottomText="60 km/h" bottomTextYOffset="-20" endValue="220" tickAlpha="0.2" valueInterval="20"> </chart:axis> </chart:axes>band元素可以将坐标轴分成不同的部分,如上图所示:<chart:axes> <chart:axis axisAlpha="0.2" axisThickness="1" bottomText="60 km/h" bottomTextYOffset="-20" endValue="220" tickAlpha="0.2" valueInterval="20"> <chart:bands> <chart:band color="#84b761" endValue="90" startValue="0"/> <chart:band color="#fdd400" endValue="130" startValue="90"/> <chart:band color="#cc4748" endValue="220" innerRadius="95%" startValue="130"/> </chart:bands> </chart:axis> </chart:axes>endValue和startValue属性用来设置图表的值域范围,valueInterval属性用来显示仪表盘标尺刻度。
事件和处理器
|
如需使用 Jmix Studio 生成处理器的桩代码,需要在界面 XML 描述或者 Jmix UI 层级结构面板选中该组件,然后用 Jmix UI 组件面板的 Handlers 标签页生成。 或者可以使用界面控制器顶部面板的 Generate Handler 按钮。 |
更多细节,参阅 AmCharts 文档。
本页是否有帮助?

感谢您的反馈