数据绑定
DataProvider
dataSet 元素可以使用 DataProvider 的实现作为数据源。DataProvider 的实例通过图表组件的 DataSet.Source XML 元素传递到 withDataProvider() 方法中。
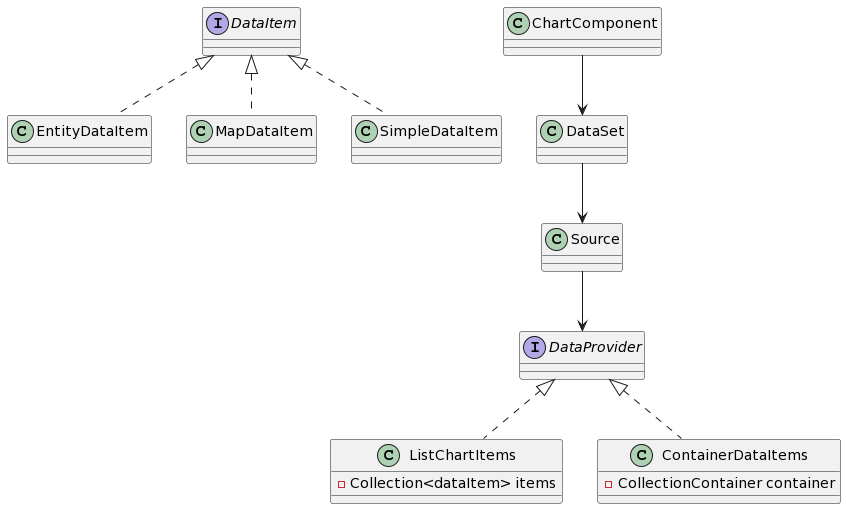
框架中有 DataProvider 接口的两个标准实现:ListChartItems 和 ContainerChartItems 类,使用时,需根据数据源的要求进行选择。
ListChartItems
ListChartItems 可以支持为图表手动添加数据项,以展示非实体数据或动态组织的数据。
ListChartItems 的实现包含了一组 DataItem 实例的集合。DataItem 接口具有三种实现:
-
EntityDataItem包含任意实体实例,用于展示图表数据:// ... ListChartItems<EntityDataItem> entityChartItems = new ListChartItems<>( List.of( new EntityDataItem(createValueDescriptionEntity(75, "Sky")), new EntityDataItem(createValueDescriptionEntity(7, "Shady side of pyramid")), new EntityDataItem(createValueDescriptionEntity(18, "Sunny side of pyramid")) ) ); entityChart.withDataSet( new DataSet().withSource( new DataSet.Source<EntityDataItem>() .withDataProvider(entityChartItems) .withCategoryField("description") .withValueField("value") ) ); } protected ValueDescription createValueDescriptionEntity(Integer value, String description) { ValueDescription entity = metadata.create(ValueDescription.class); entity.setValue(value); entity.setDescription(description); return entity; } -
MapDataItem可以使用键值对数据作为图表数据源:ListChartItems<MapDataItem> mapChartItems = new ListChartItems<>( List.of( new MapDataItem(Map.of("value", 75, "description", "Sky")), new MapDataItem(Map.of("value", 7, "description", "Shady side of pyramid")), new MapDataItem(Map.of("value", 18, "description", "Sunny side of pyramid")) ) ); mapChart.withDataSet( new DataSet().withSource( new DataSet.Source<MapDataItem>() .withDataProvider(mapChartItems) .withCategoryField("description") .withValueField("value") ) ); -
SimpleDataItem支持使用任何public类的实例定义图表数据:ListChartItems<SimpleDataItem> simpleChartItems = new ListChartItems<>( List.of( new SimpleDataItem(new ValueDescriptionDTO(75, "Sky")), new SimpleDataItem(new ValueDescriptionDTO(7, "Shady side of pyramid")), new SimpleDataItem(new ValueDescriptionDTO(18, "Sunny side of pyramid")) ) ); simpleChart.withDataSet( new DataSet().withSource( new DataSet.Source<SimpleDataItem>() .withDataProvider(simpleChartItems) .withCategoryField("description") .withValueField("value") ) );
ContainerDataItems
ContainerDataItems 用于为 Chart 组件分配一个 CollectionContainer。这种方式要求使用已有实体表示图表数据。
例如,我们有一个数据容器加载了 VehicleCount 实例。下面是视图 XML 的相关代码:
<collection id="vehiclesDc"
            class="com.company.demo.entity.VehicleCount">
    <fetchPlan extends="_local"/>
    <loader id="vehiclesDl" readOnly="true">
        <query>
            <![CDATA[select e from VehicleCount e order by e.year]]>
        </query>
    </loader>
</collection>
视图控制器中定义了 onInit() 方法,其中为图表设置一个基于 vehiclesDc 的 data provider。
chart.setDataSet(
        new DataSet().withSource(
                new DataSet.Source<EntityDataItem>()
                        .withDataProvider(new ContainerChartItems<>(vehiclesDc))
                        .withCategoryField("year")
                        .withValueFields("cars", "motorcycles", "bicycles")
        )
);
如需声明式绑定数据,可以用 XML dataSet 中 source 的 dataContainer 属性:
<charts:dataSet>
    <charts:source dataContainer="vehiclesDc"
                   categoryField="year"
                   valueFields="cars motorcycles bicycles"/>
</charts:dataSet>
仪表盘的数据绑定
与其他图表不同,仪表盘(gauge)不支持 DataSet。
为 gauge 图表添加数据时,可以按照下面示例中的做法,在 XML 的 series.data 中定义 dataItem 元素:
<charts:series>
    <charts:gauge id="gaugeSeries" name="Pressure">
        <charts:data>
            <charts:dataItem value="50" name="SCORE"/>
        </charts:data>
    </charts:gauge>
</charts:series>
或者,在 Java 控制器中,获取 series 属性,然后通过 setData() 方法编程式的绑定数据。
GaugeSeries gaugeSeries = chart.getSeries("gaugeSeries");

gaugeSeries.setData(
        new GaugeSeries.DataItem()
                .withValue(50.0).withName("SCORE")
);
仪表盘图中使用的 DataItem 对象与本节中其他的 DataItem 是不同的。
|
