地图组件
地图
通过 Jmix Studio 添加地图组件。
点击操作面板中的 Add Component,找到 GeoMap 并双击。
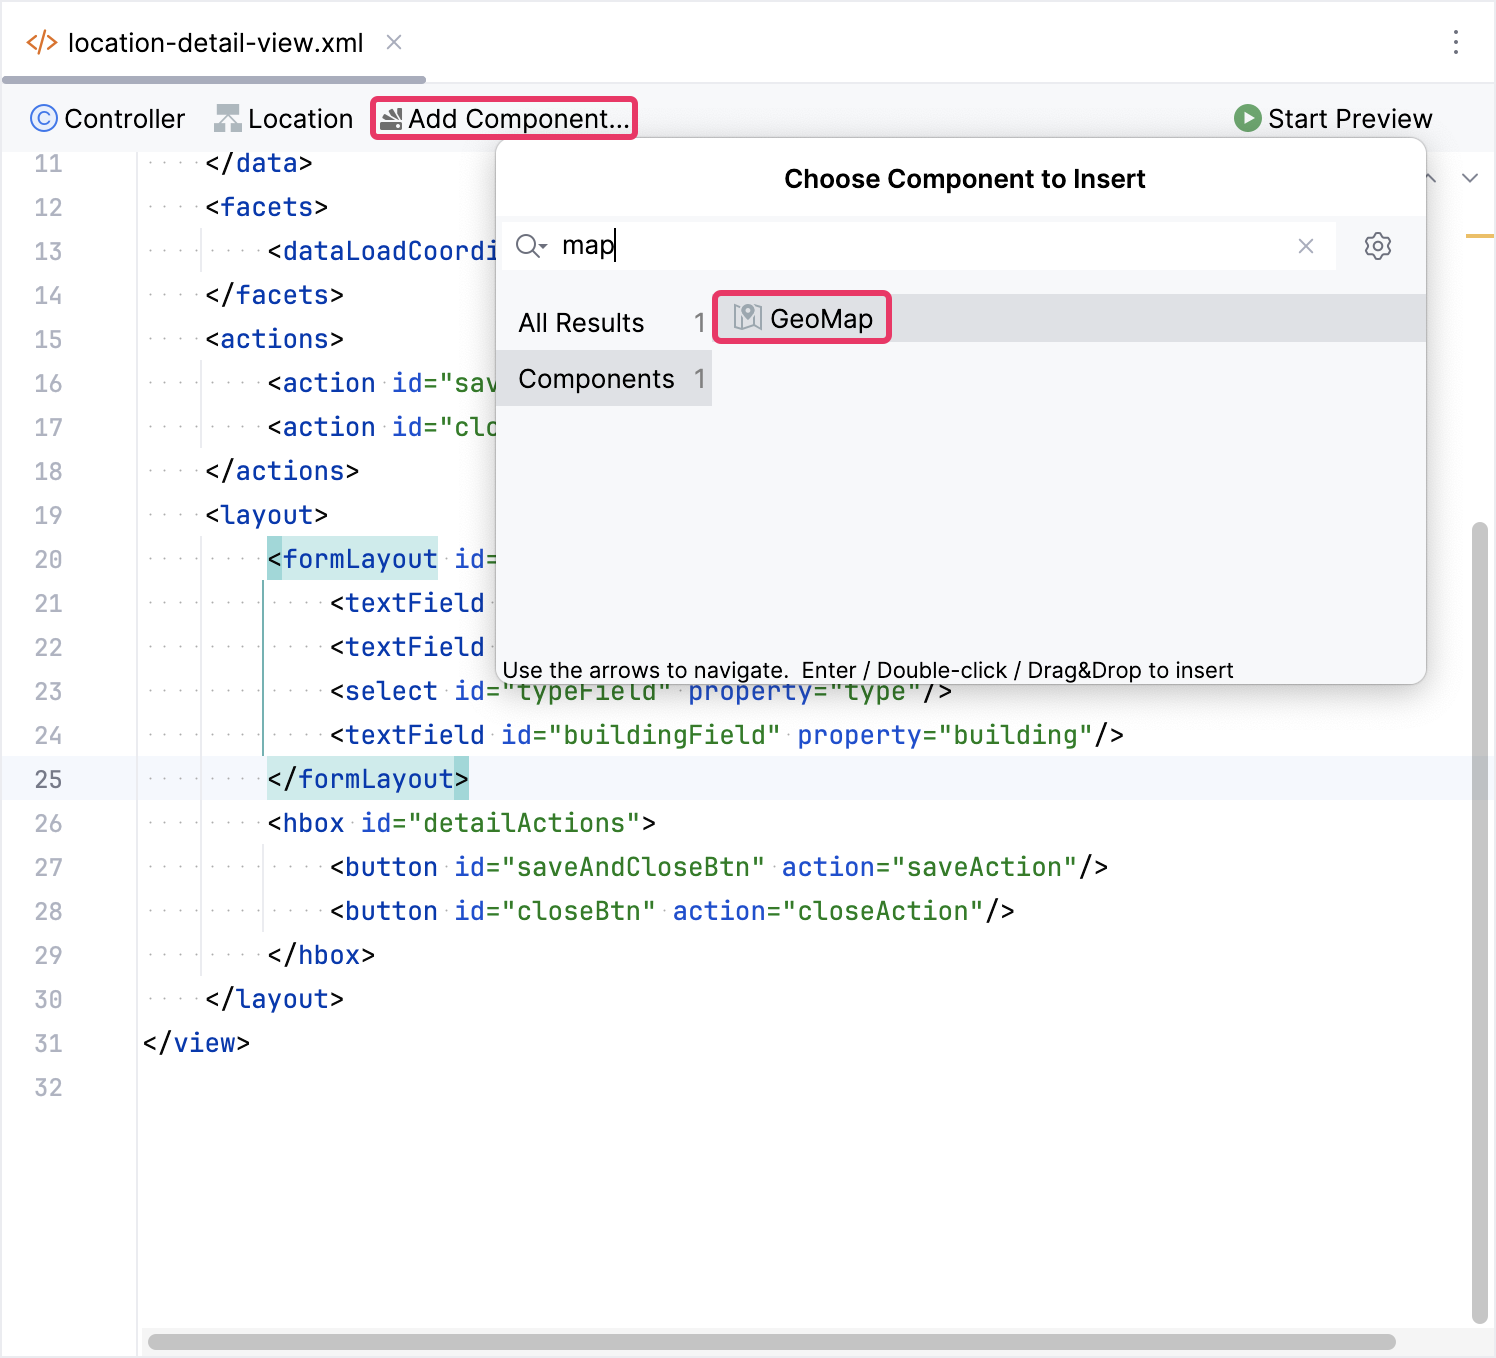
<maps:geoMap id="map"
             height="100%"
             width="100%"/>
如果不使用视图设计器,可以在视图的 XML 中手动添加 maps 命名空间:
<view xmlns="http://jmix.io/schema/flowui/view"
      xmlns:maps="http://jmix.io/schema/maps/ui"
      title="msg://mapBasicView.title">
通过 Jmix UI 结构面板的 Inject to Controller 操作可以将 UI 组件或地图图层注入 Java 控制器。
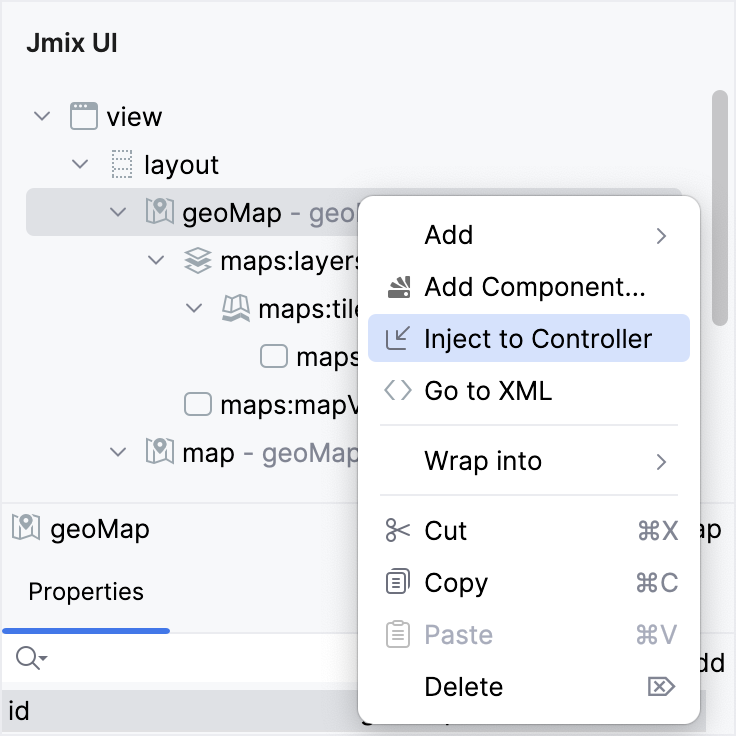
或者,也可以使用操作面板的 Inject 按钮注入:
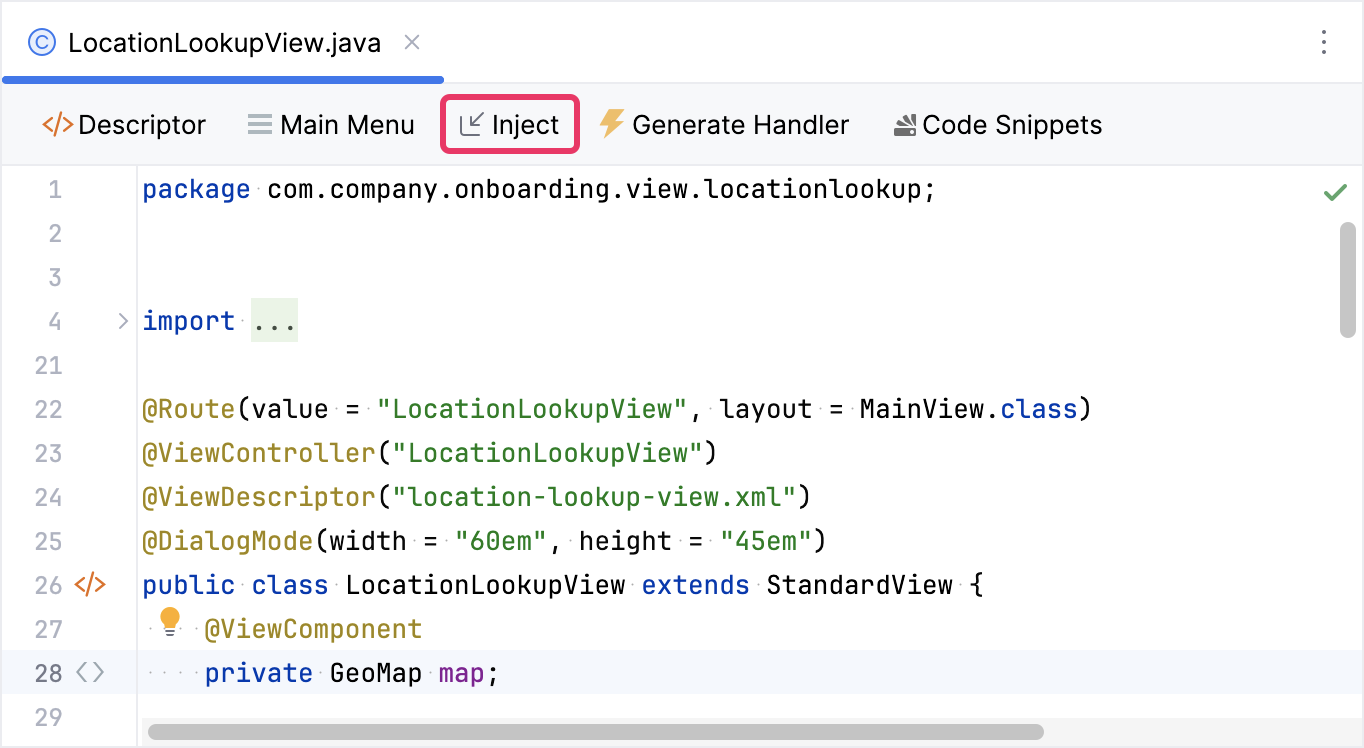
对于需要注入控制器的 UI 组件,必须要有 id 属性。
|
现在可以直接以编程的方式与 GeoMap 组件交互:
@ViewComponent
private GeoMap geoMap;

@Subscribe
public void onInit(final InitEvent event) {
    geoMap.addLayer(new TileLayer()
            .withSource(new OsmSource()
                    .withUrl("https://tile.openstreetmap.org/{z}/{x}/{y}.png")
                    .withOpaque(true)
                    .withMaxZoom(10)));
}
图层
GeoMap 组件可以包含多个 图层,以展示不同类型的地理信息,例如栅格层、矢量层。
初始时,地图没有任何图层。
示例,我们在地图中添加一个 瓦片层。
在 Jmix UI 结构面板或视图的 XML 中,选择 geoMap 元素,然后点击组件面板的 Add 按钮。在下拉框中选择 Layers → TileLayer。
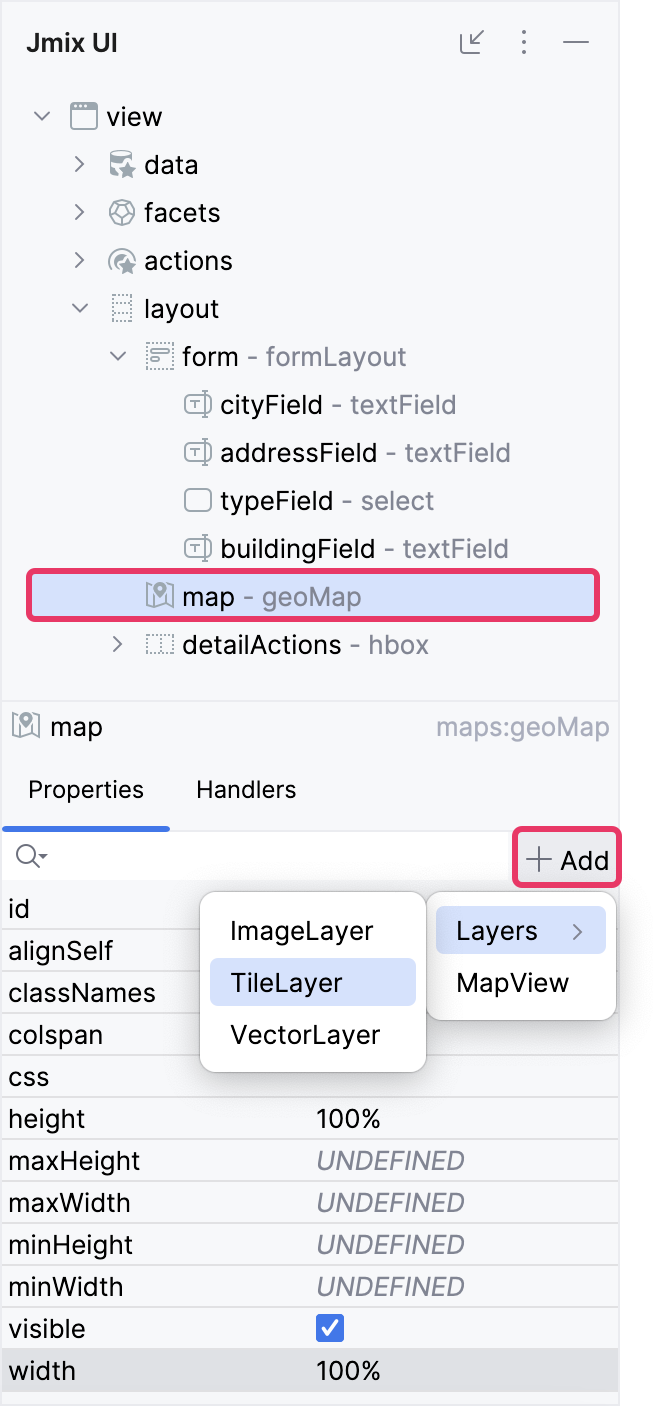
可以将图层 注入 控制器,然后直接以编程的方式与图层交互:
@ViewComponent("map.tile")
private TileLayer mapTile;

@Subscribe
public void onInit(final InitEvent event) {
    mapTile.setSource(new XyzSource()
            .withUrl("https://server.arcgisonline.com/ArcGIS/rest/services/World_Topo_Map/MapServer/tile/{z}/{y}/{x}"));
}
数据源
一个 数据源 表示用于渲染地图组件中图层的数据。数据源提供的空间信息定义了图层的内容和外观。
示例,我们为瓦片层添加一个 OsmSource。
在 Jmix UI 结构面板或视图的 XML 中,选择 maps:tile 元素,然后点击组件面板的 Add 按钮。在下拉框中选择 OsmSource。
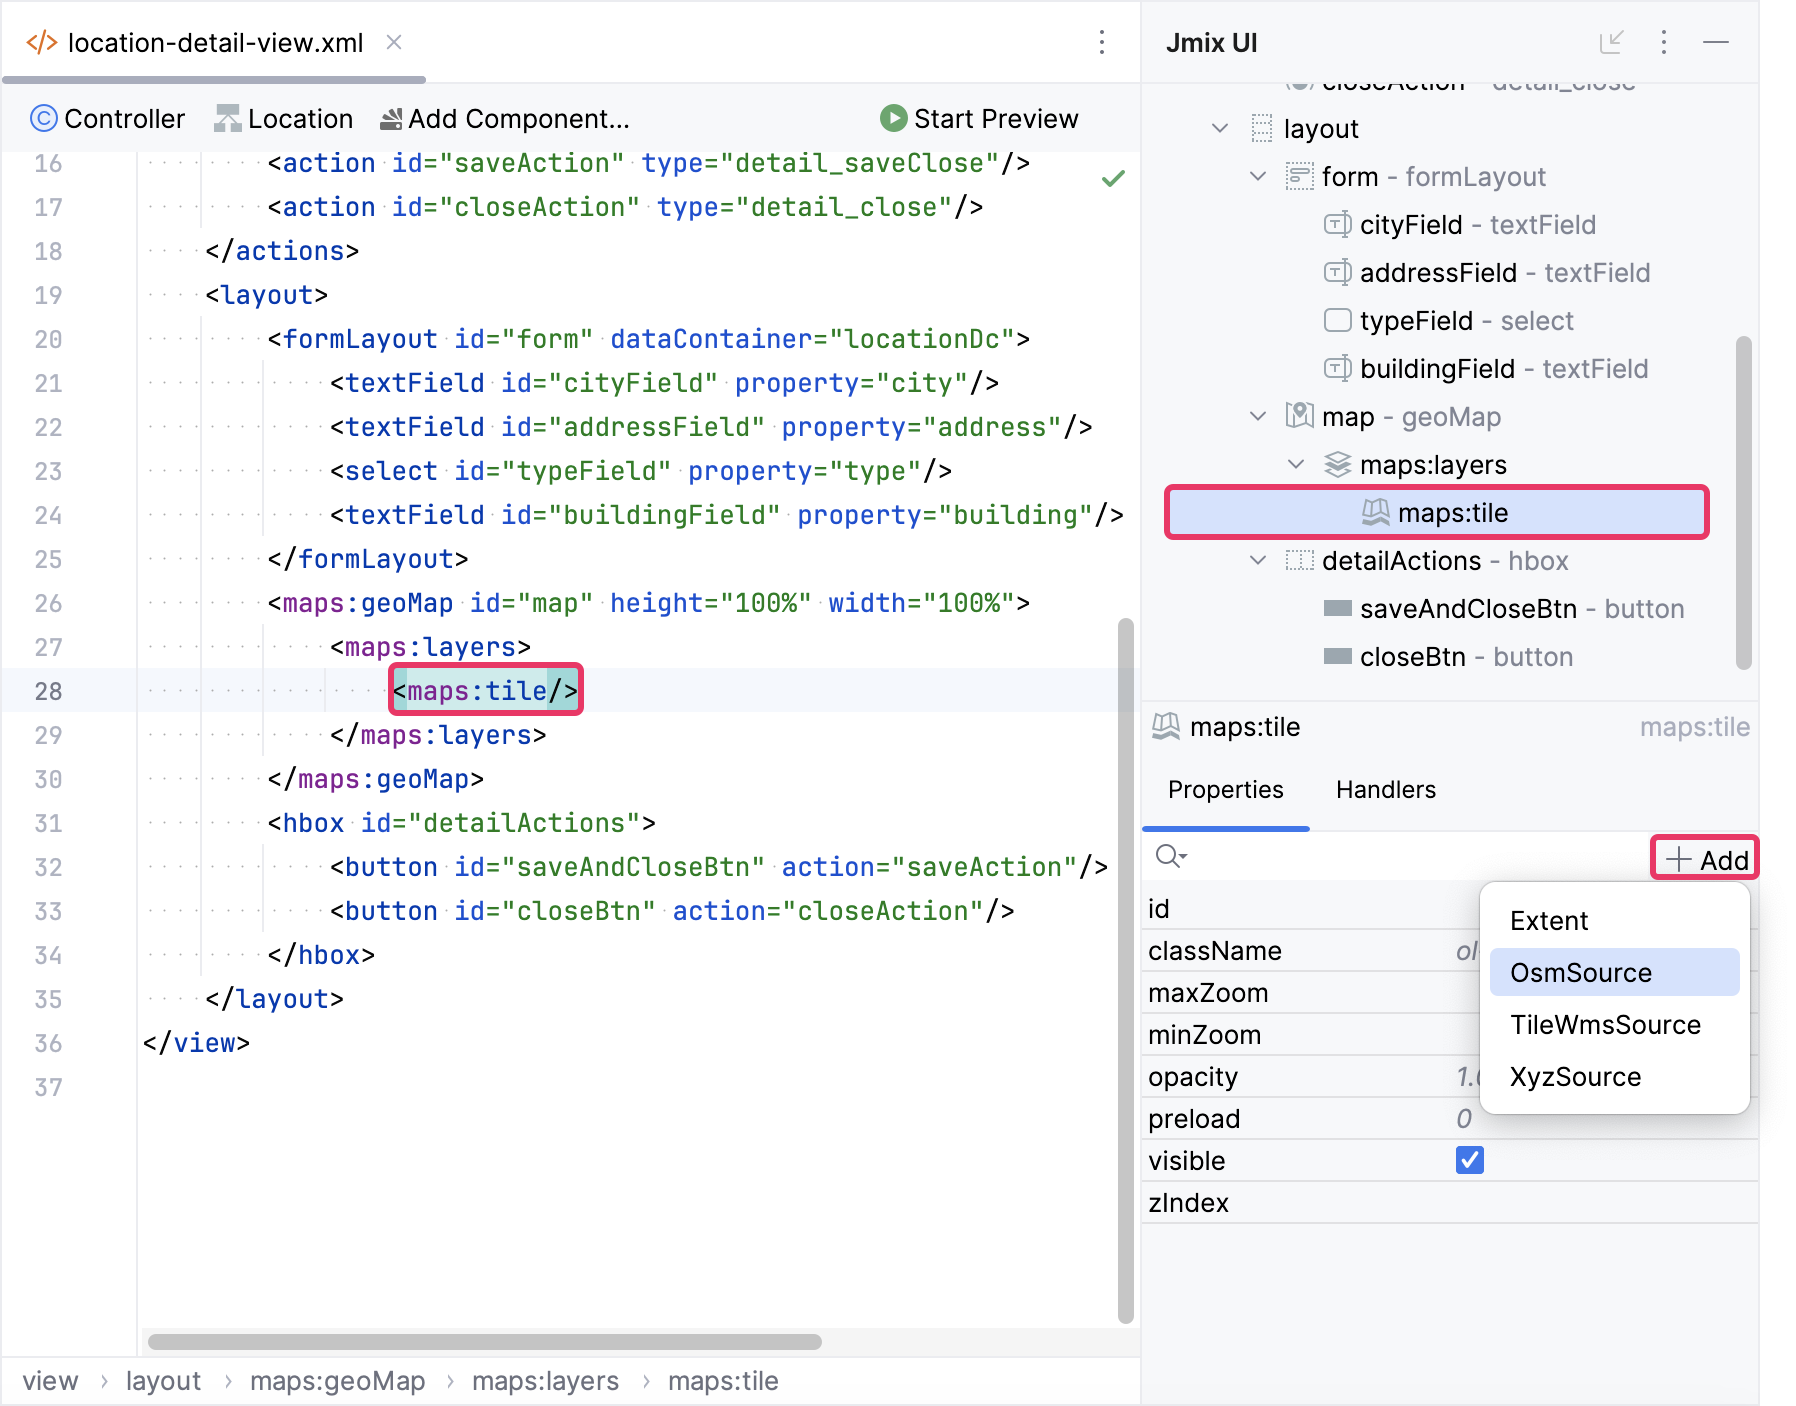
<maps:layers>
    <maps:tile>
        <maps:osmSource attributions="© Your Attribution Info"
                        maxZoom="34"/>
    </maps:tile>
</maps:layers>
You can inject a source into the controller and interact with it programmatically by accessing its methods directly:
@ViewComponent("map.tile.osmSource")
private OsmSource osmSource;

@Subscribe
public void onInit(final InitEvent event) {
    osmSource.withUrl("https://tile.openstreetmap.org/{z}/{x}/{y}.png")
            .withMaxZoom(12)
            .withWrapX(false);
}
地图视图
View 定义地图的展示方式,包括中心点、缩放级别、旋转以及投影,设置地图在 UI 加载时的初始状态。
默认情况下,geoMap 组件展示一个世界地图,地理中心为 (0,0)。
在 Jmix UI 结构面板或视图的 XML 中,选择 geoMap 元素,然后点击组件面板的 Add 按钮。在下拉框中选择 MapView。
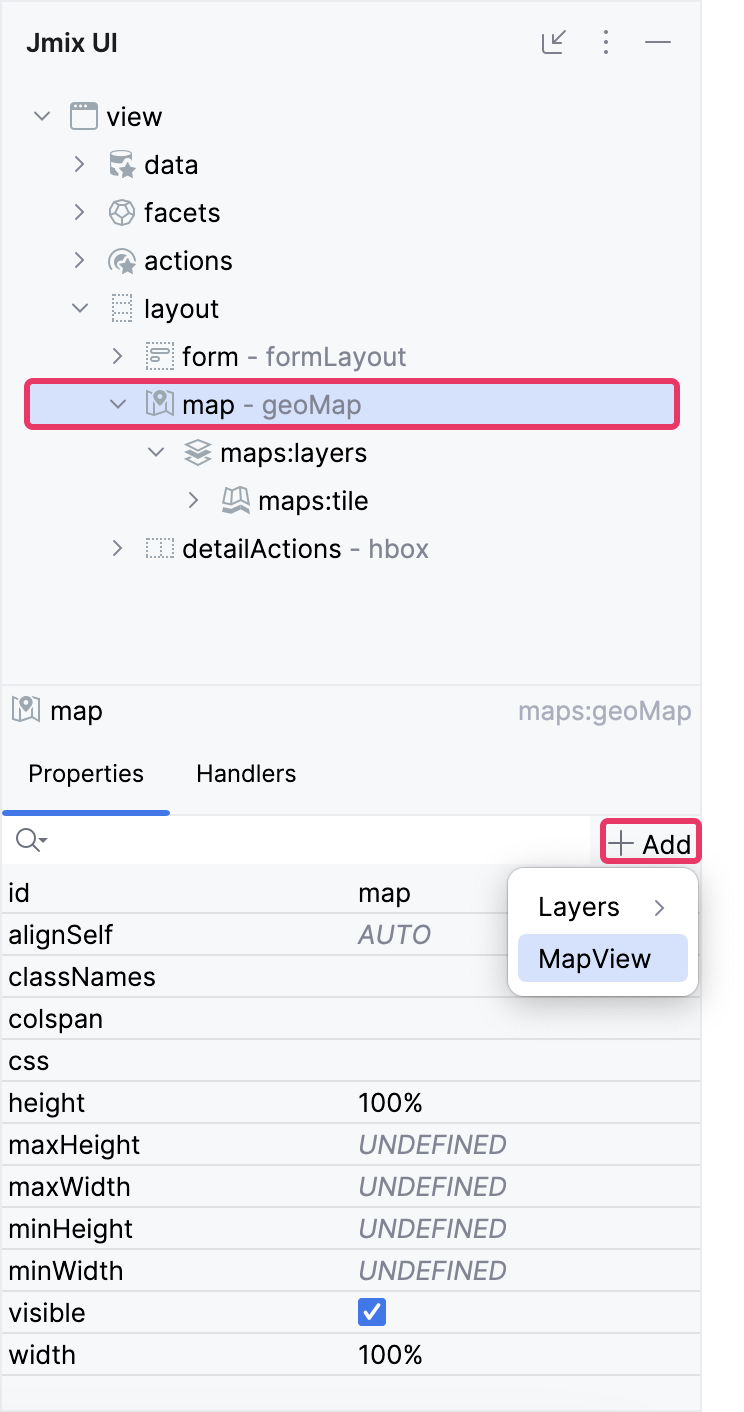
<maps:mapView centerX="10.872461786203276"
              centerY="48.36928140366503"
              zoom="4.0"/>
还可以设置更多参数:
-
centerX定义地图初始的纬度。值传给org.locationtech.jts.geom.Coordinate对象。 -
centerY定义地图初始的经度。值传给org.locationtech.jts.geom.Coordinate对象。 -
maxZoom- 设置 view 的最大缩放级别。 -
minZoom- 设置 view 的最小缩放级别。 -
projection值的是地图显示时的坐标参考系。通用的投影有EPSG:3857和EPSG:4326。默认投影是 EPSG:3857。可以在内部的projection元素设置自定义投影。更多详情参阅 Projection。 -
rotation- 以弧度为单位设置视图的旋转(顺时针正旋转,0 表示北)。更多详情参阅 setRotation。 -
zoom定义缩放级别。缩放级别的值从 0 开始,表示层级最高的视图,随着地图拉近放大而增加。
地图范围
地图范围通常由最小值(左上角)和最大值(右下角)坐标值定义,其形式为 [minX, minY, maxX, maxY],表示区域的边界框。
在 Jmix UI 结构面板或视图的 XML 中,选择 mapView 元素或某个图层,然后点击组件面板的 Add 按钮。在下拉框中选择 Extent,并按照下面配置 minX、minY、maxX 和 maxY 属性。
<maps:mapView centerY="51.0"
              centerX="40.0"
              zoom="4.0">
    <maps:extent minX="-15.0"
                 minY="30.0"
                 maxX="40.0"
                 maxY="60.0"/>
</maps:mapView>