开始使用
本章节通过创建几个简单的报表带你快速了解报表扩展组件的基本功能。
本节中的示例基于 快速入门 中创建的 Onboarding 应用程序。我们将创建两个报表:
-
User Profile:显示所选用户的主要详细信息以及入职步骤列表。
-
List of Users:显示用户列表及其角色。
TIP:另请参阅 Report Generation 指南,其中包含具有复杂结构和各种输出类型的报表的实际示例。
项目配置
-
下载并解压 Jmix Onboarding 项目,或者直接用 Git 克隆:
git clone https://github.com/jmix-framework/jmix-onboarding.git
-
按 打开已有项目 的说明在 Studio 打开
jmix-onboarding项目。 -
按 安装 部分的说明添加报表扩展组件。
运行时创建报表
在本节中,我们将使用运行中的应用程序提供的向导创建 User Profile 报表。报表定义和模板将存储在数据库中。
使用 IDE 的 Onboarding Jmix Application run/debug 配置启动应用程序,打开 http://localhost:8080 并使用用户名 admin 和密码 admin 登录。
-
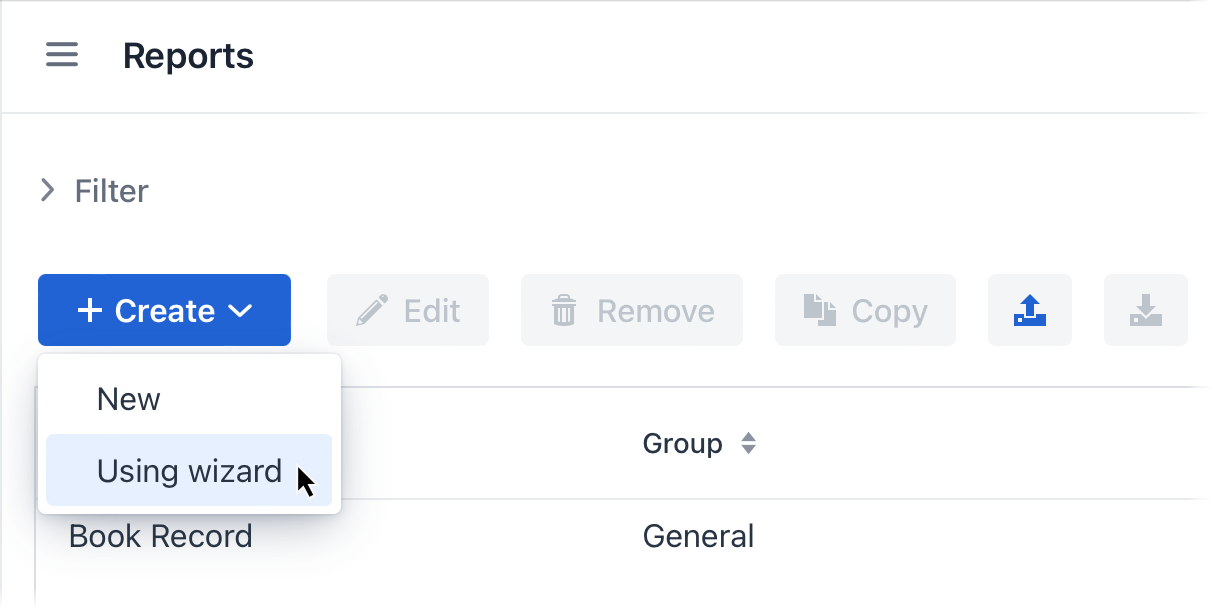
打开 Reports → Reports 视图,然后点击 Create → Using wizard 运行报表创建向导。
在向导的第一步输入以下参数:
-
Entity:
User -
Template type:
DOCX -
Report name:
User Profile -
Report code:
user-profile -
Report type:
Report for single entity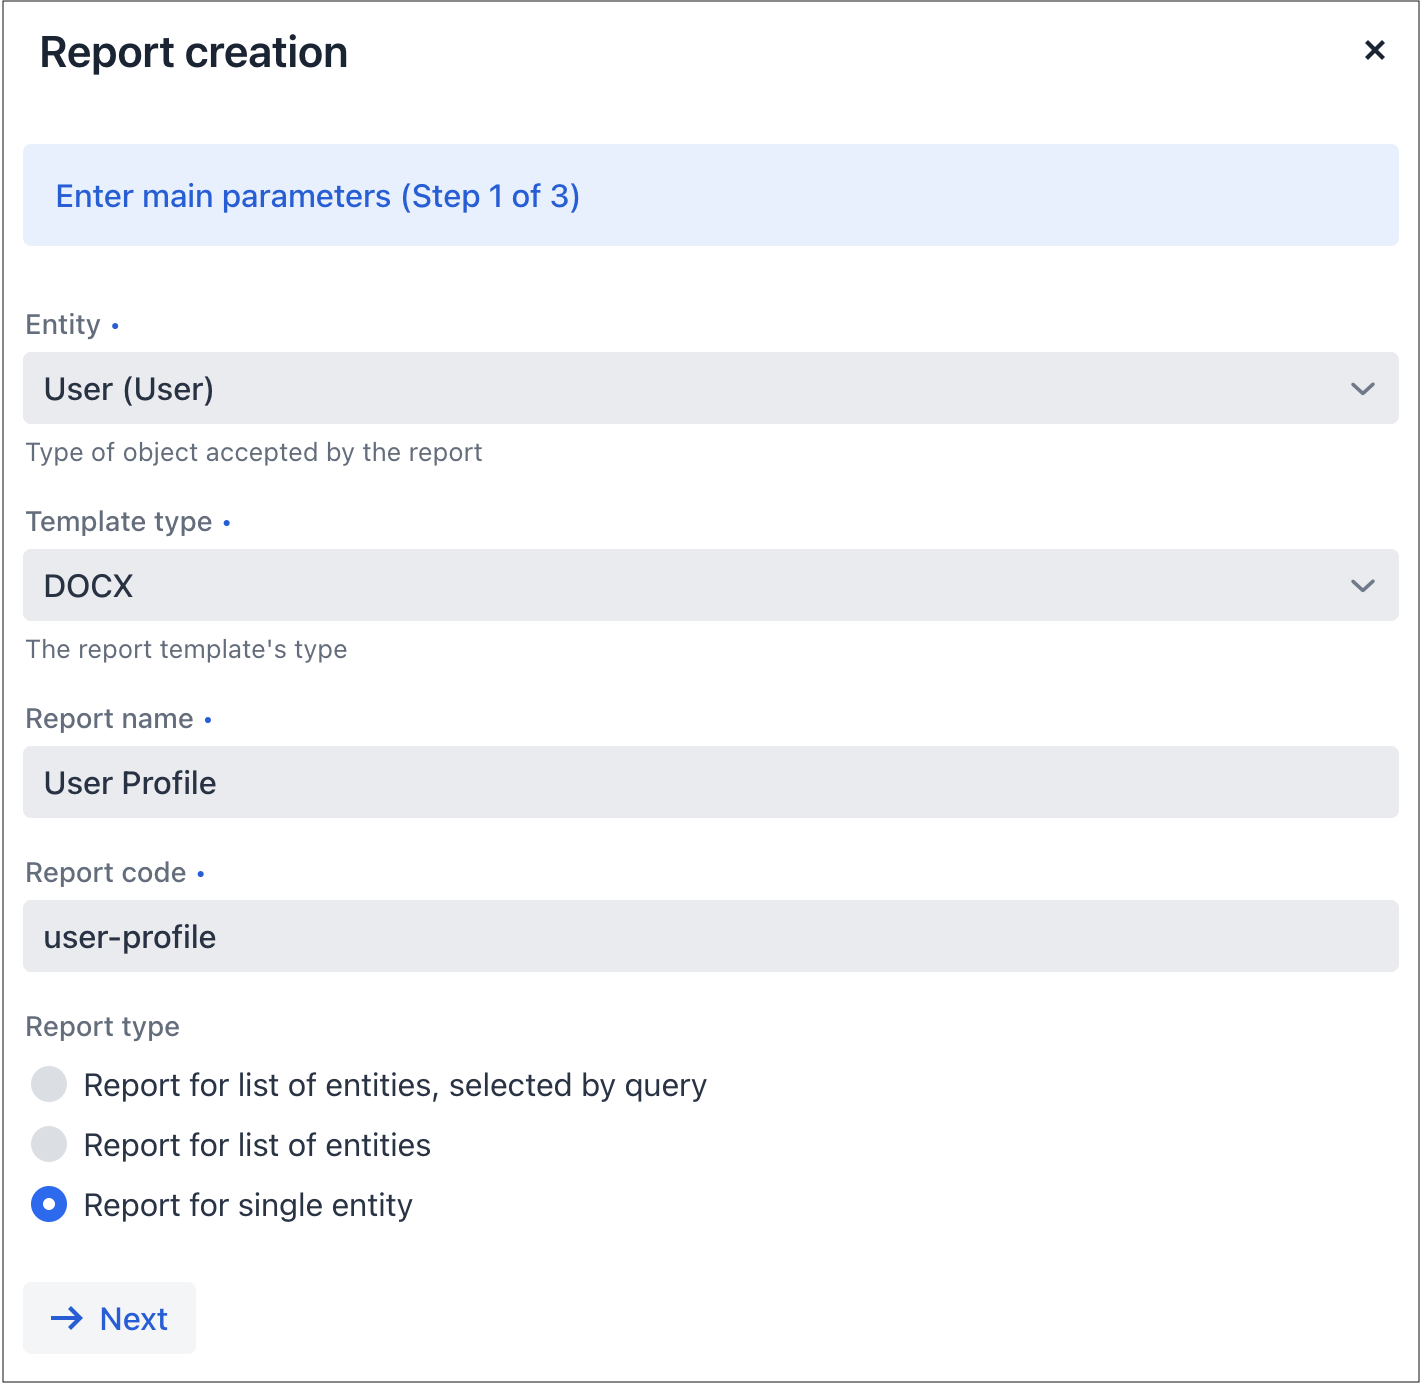
-
-
在向导的下一步中,设置需要在报表中显示的
User实体及其关联的Department属性。这些属性构成“简单区域”。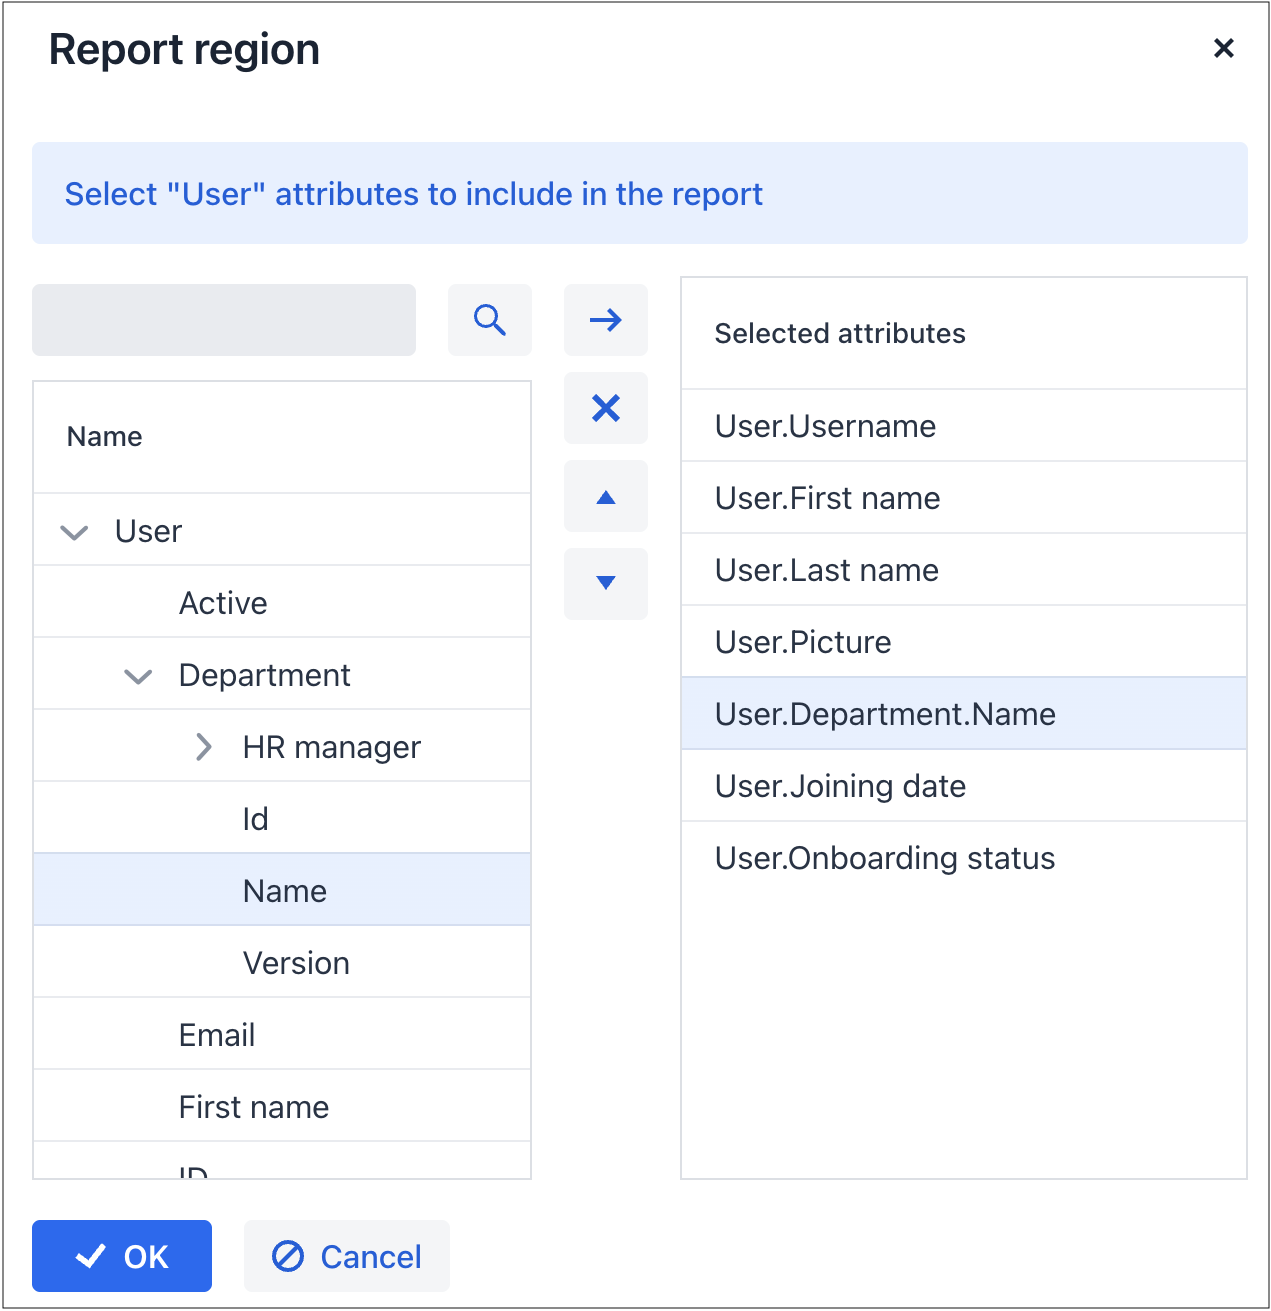
点击 OK 进入下一步:编辑报表区域。
-
视图中包含一个命名区域(即带区)列表,显示相关的数据。如果实体包含集合属性,则启用 Add tabulated region 按钮。
点击 Add tabulated region 按钮,创建一个显示
User实例入职步骤列表的带区。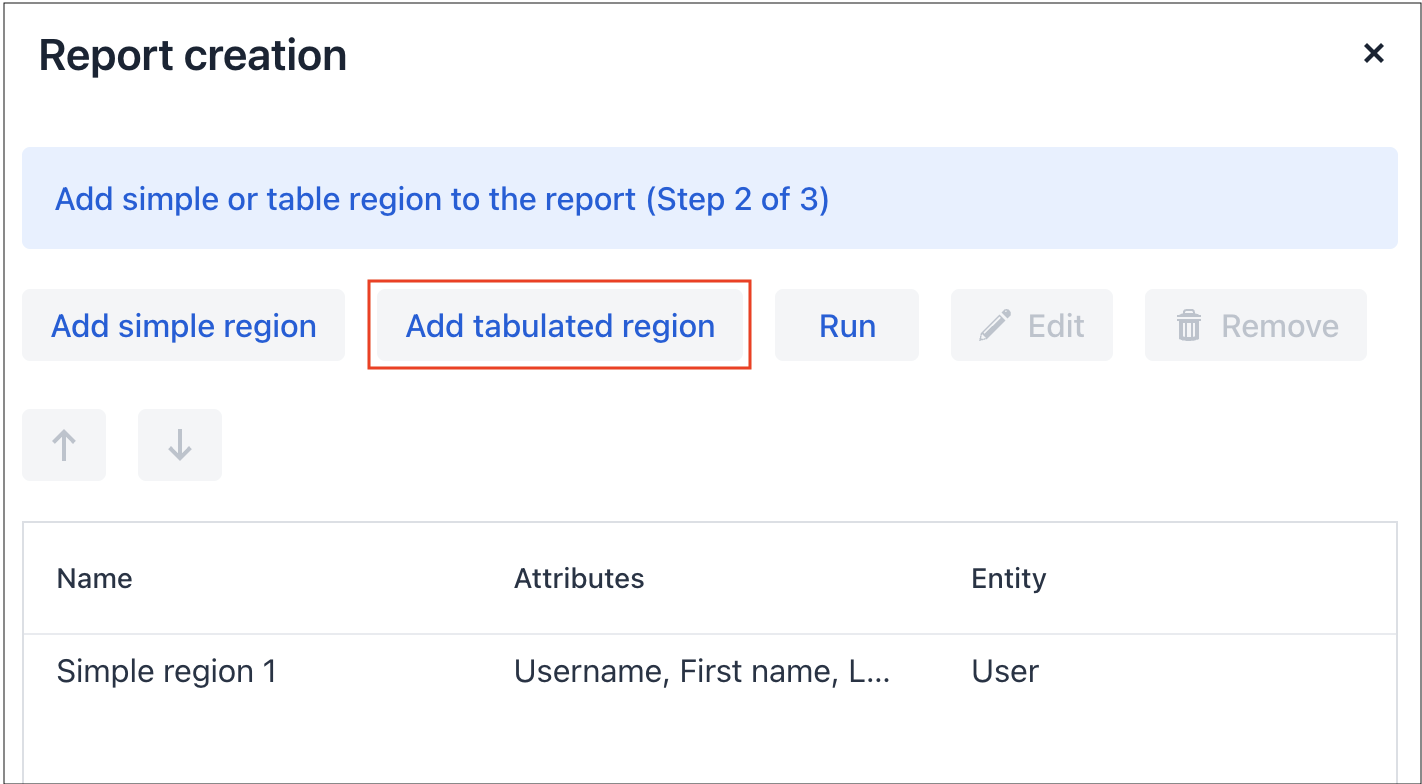
在 Select attributes 对话框中选择
User.Steps。然后选择
Steps.Step.Name、Due date和Completed date属性。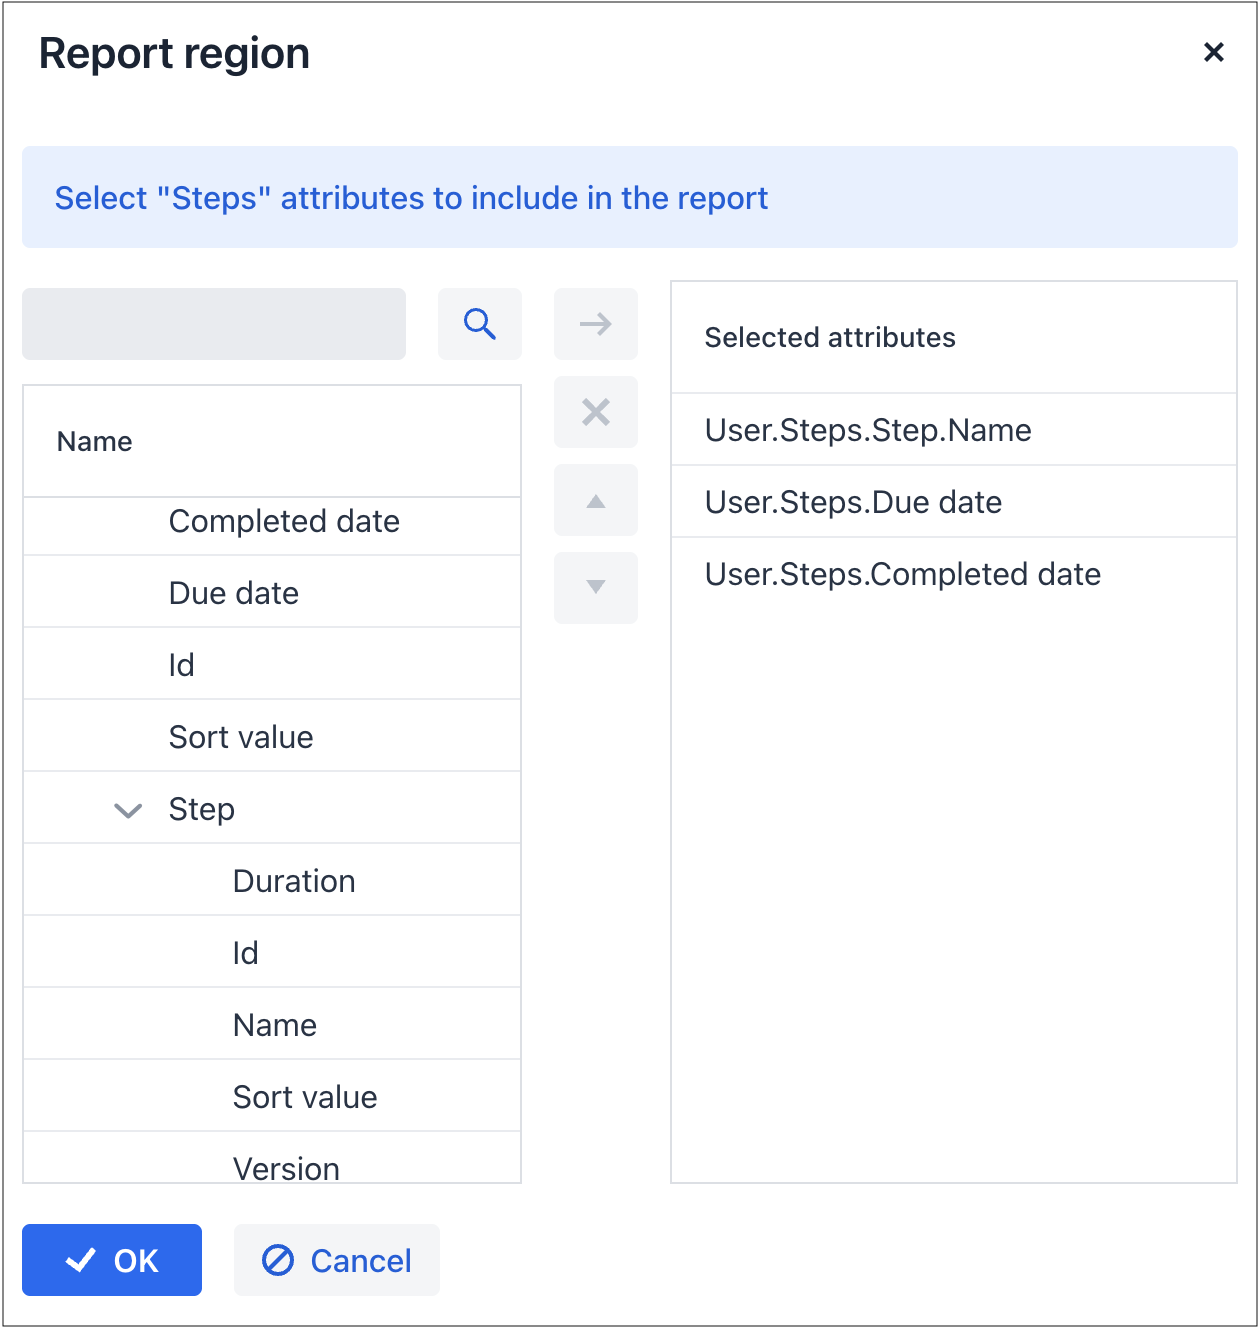
点击 OK,然后点击 Next 进入最后一步,可以在其中调整输出文件名和格式。点击 Save。
-
向导完成并打开报表详情视图。可以查看已创建的报表结构并运行报表。
-
如需渲染报表中的用户图片,为该字段创建一个 值格式。切换到 Value formats 标签页,然后点击 Create。在 Name 字段中输入
User1.picture,在 Format string 字段中输入${imageFileId:200x200}: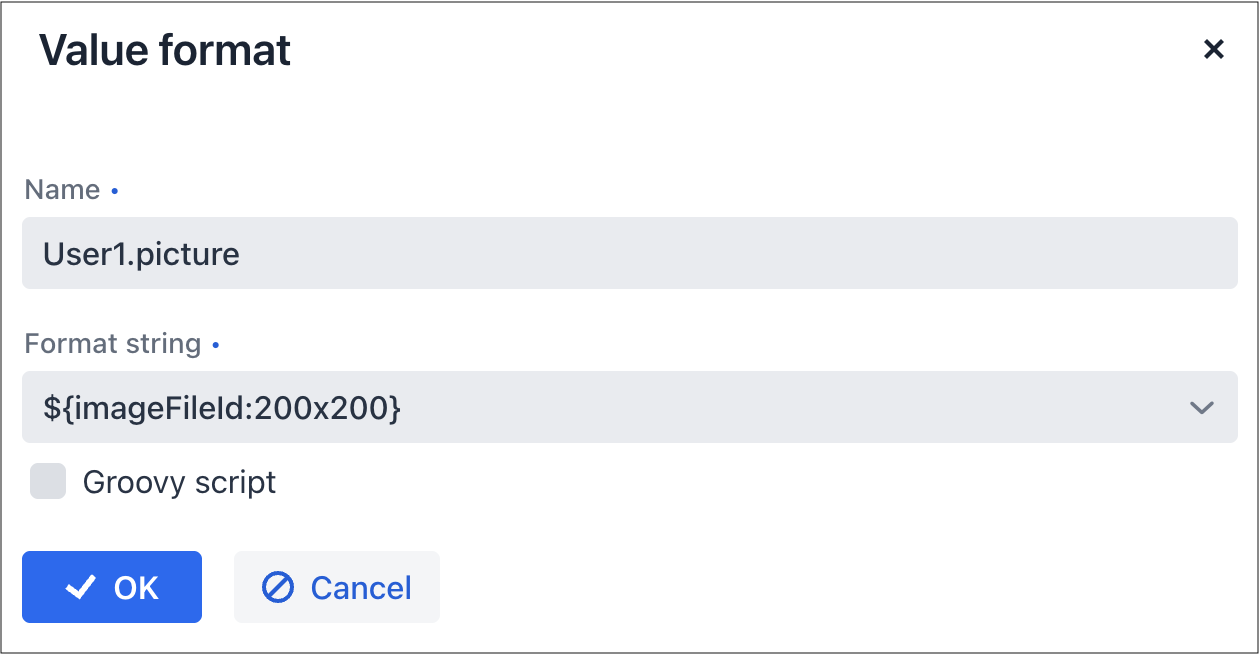
保存值格式。
-
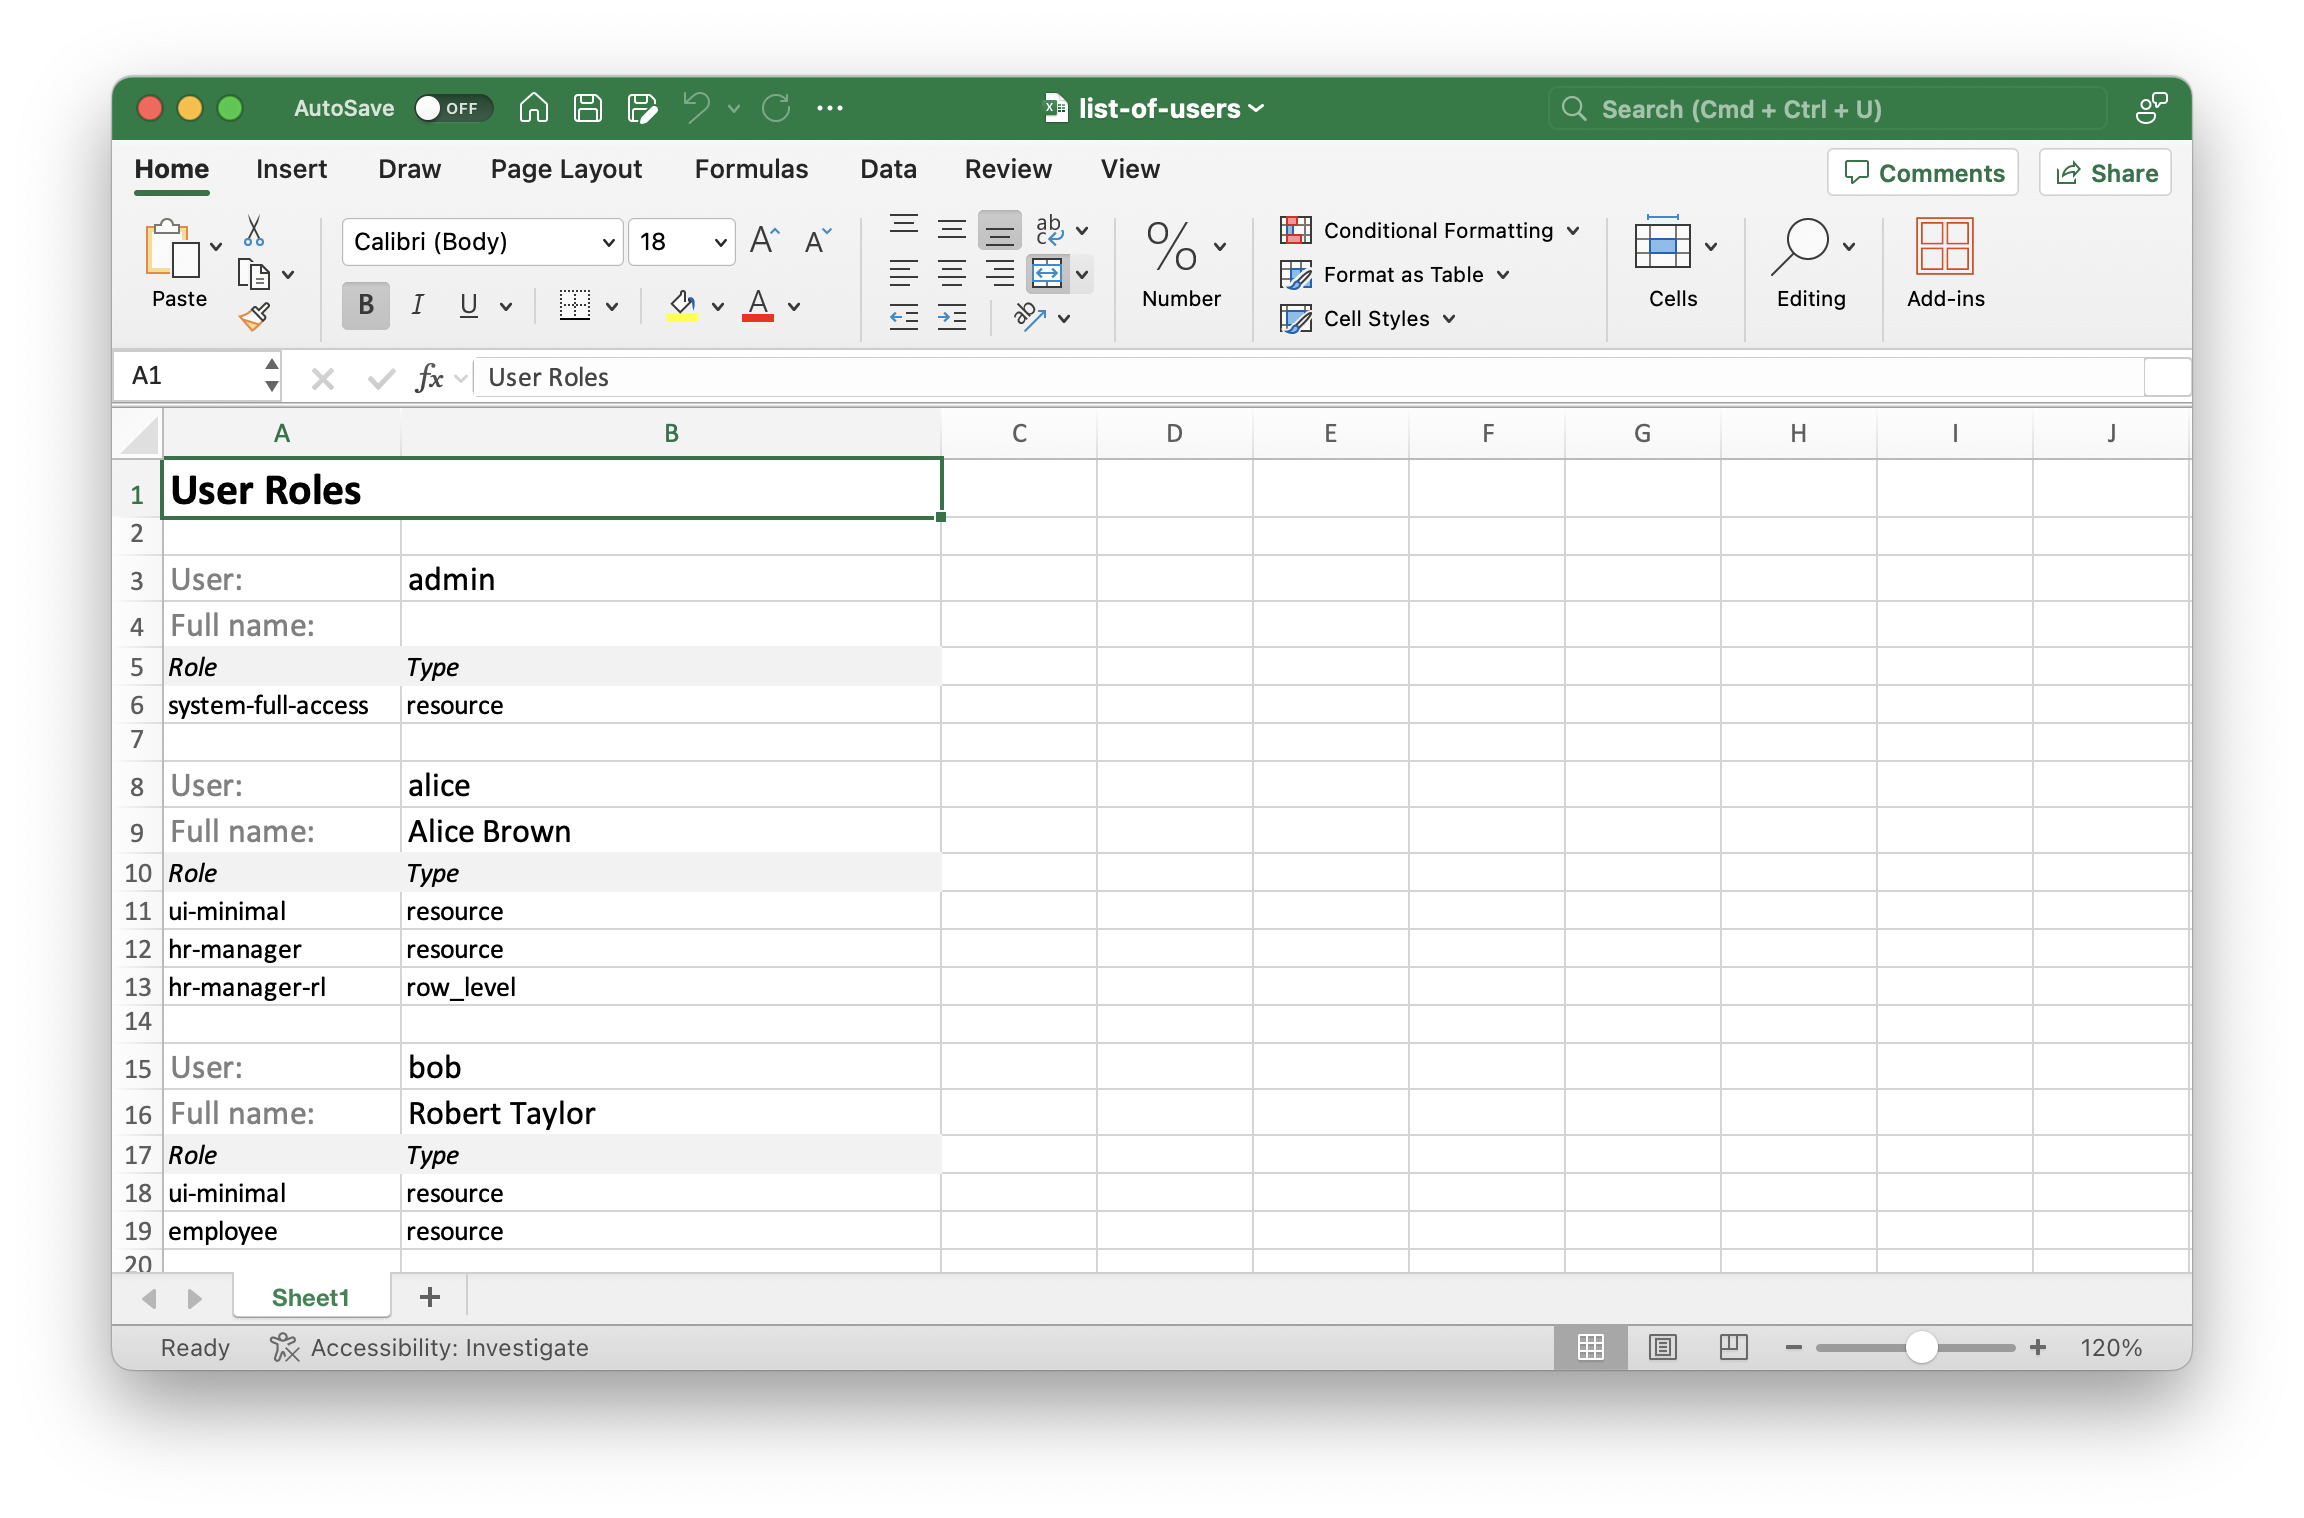
可以通过修改 Templates 标签页内的模板来调整报表的输出结果。下面我们将展示由向导自动创建的默认模板生成的输出。
-
点击 Run,然后在 Input parameters 对话框窗口中选择一个用户。
报表将由浏览器生成并下载为
User Profile.docx文件。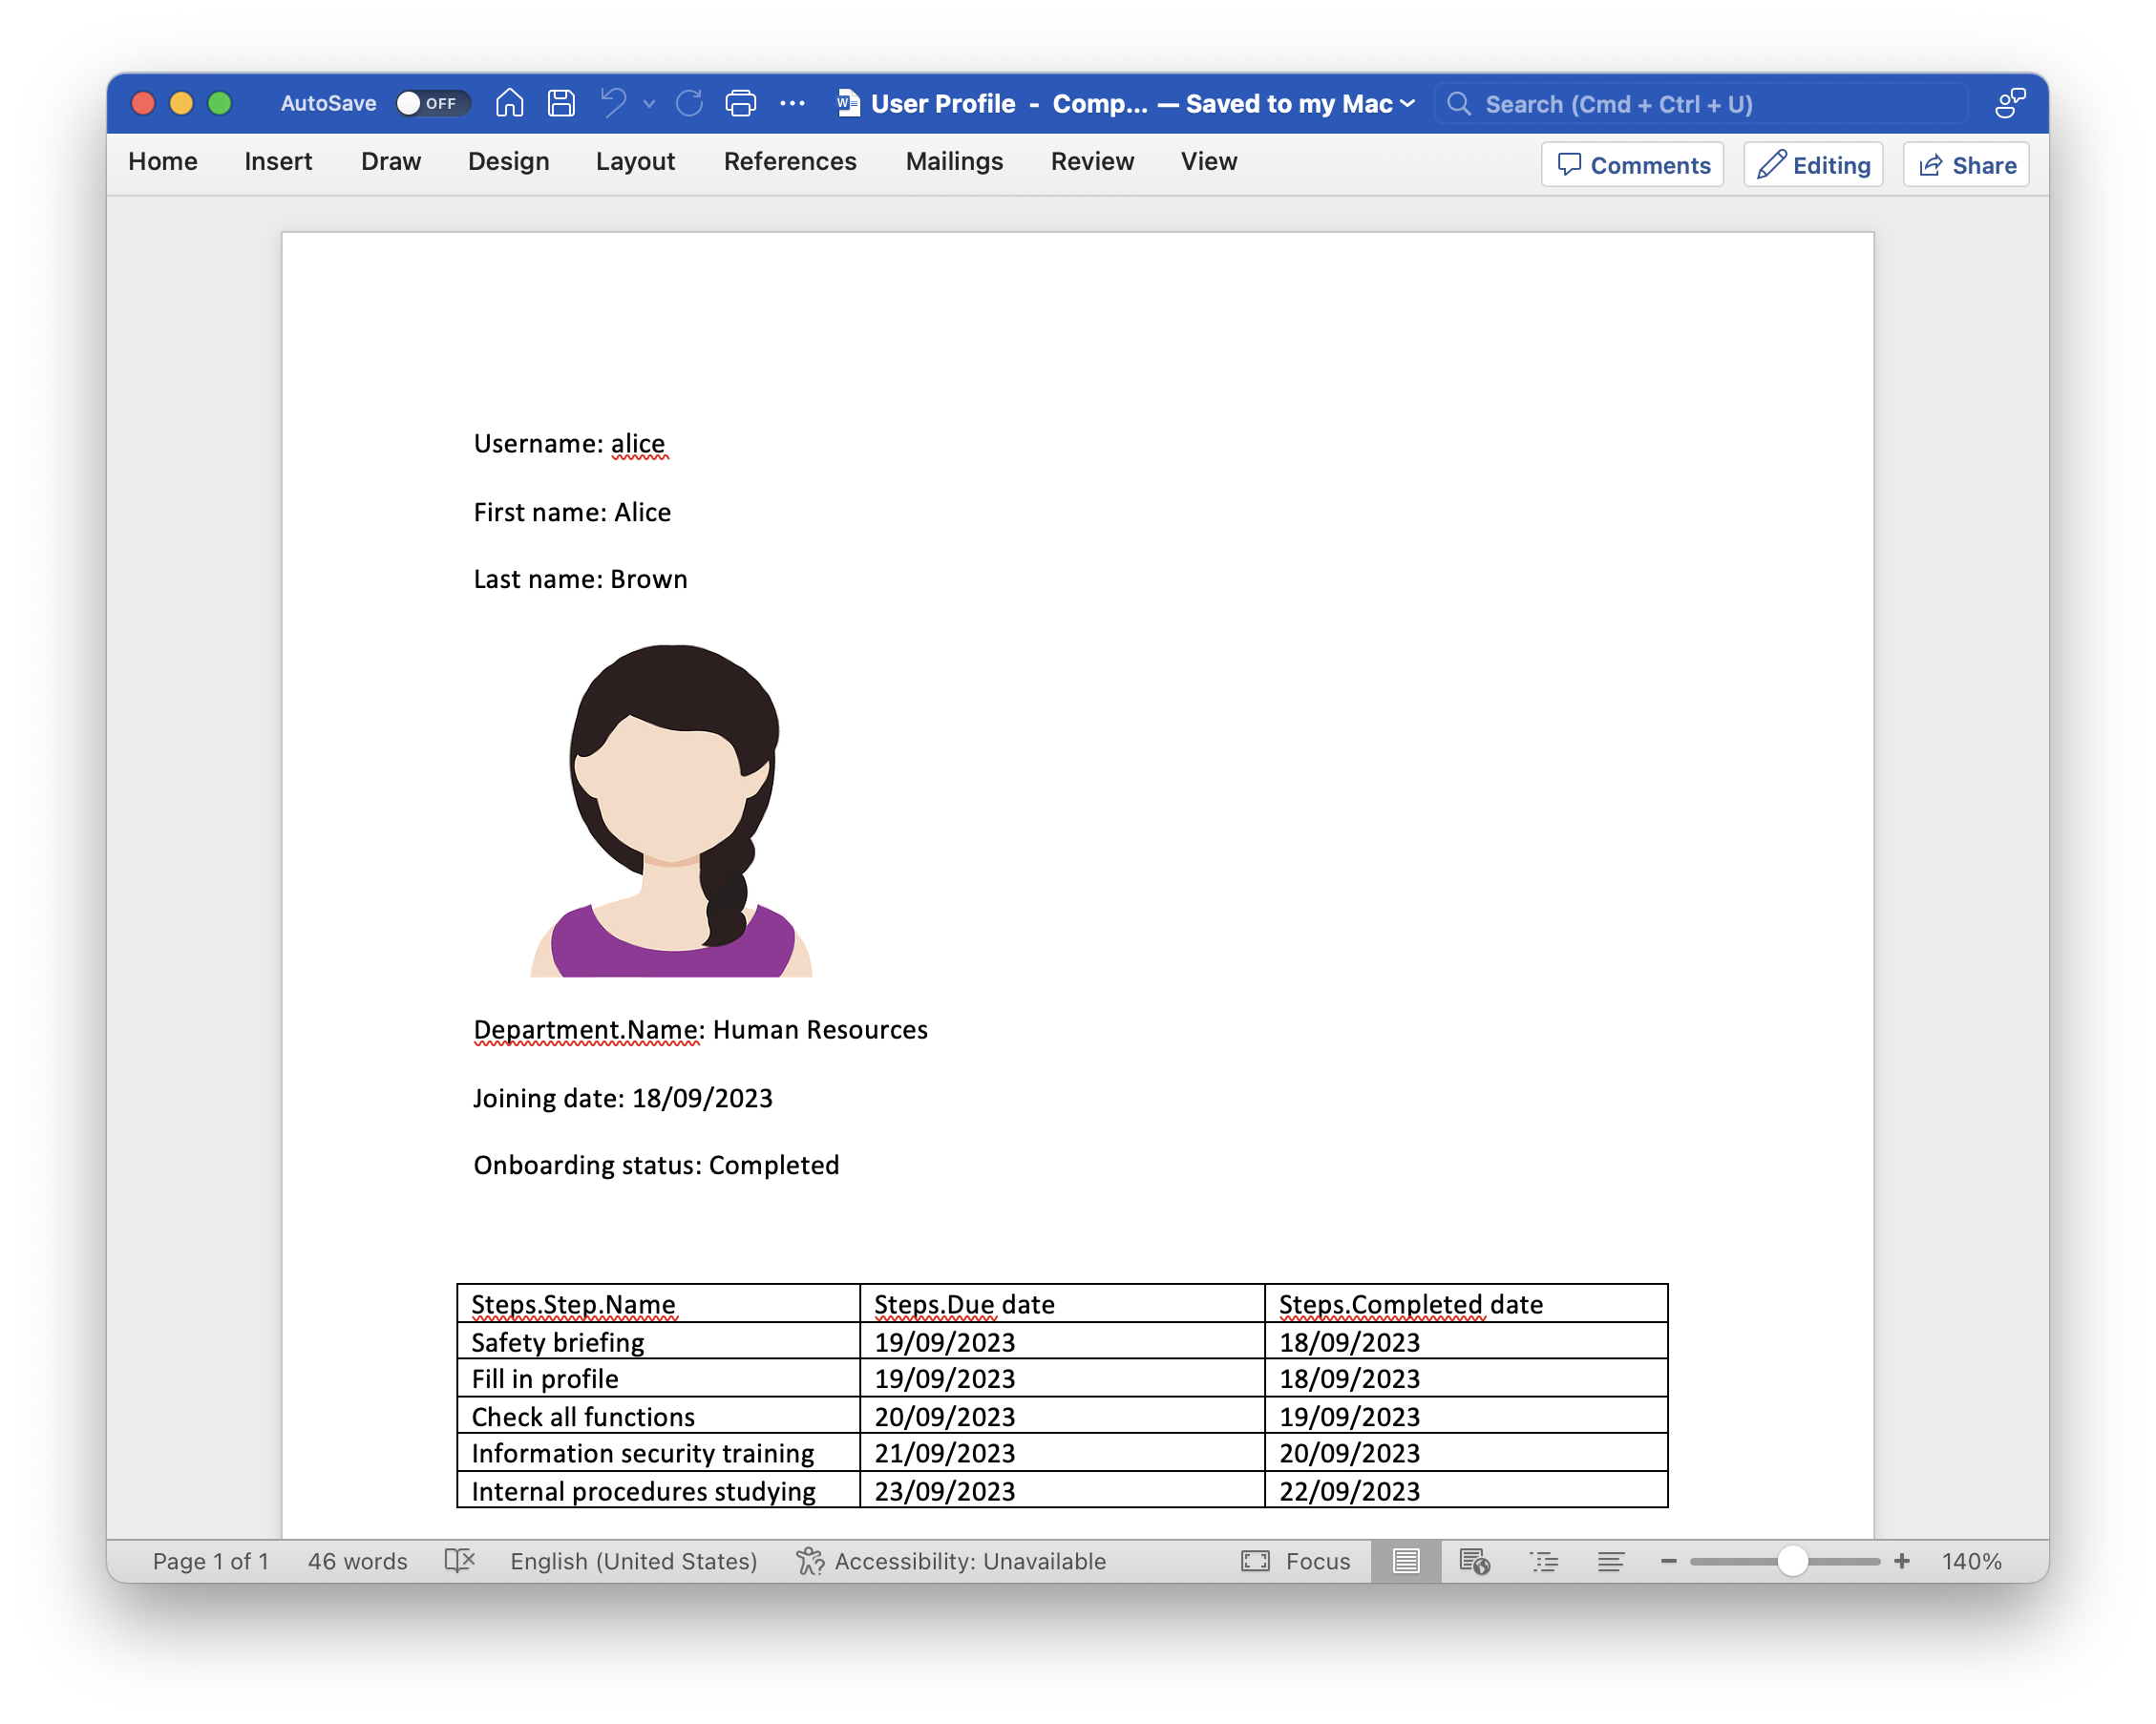
-
现在配置应用程序:从 Users 视图运行该报表。
切换到报表详情视图的 Roles and views 标签页,并将
User.list添加到 Views 列表中: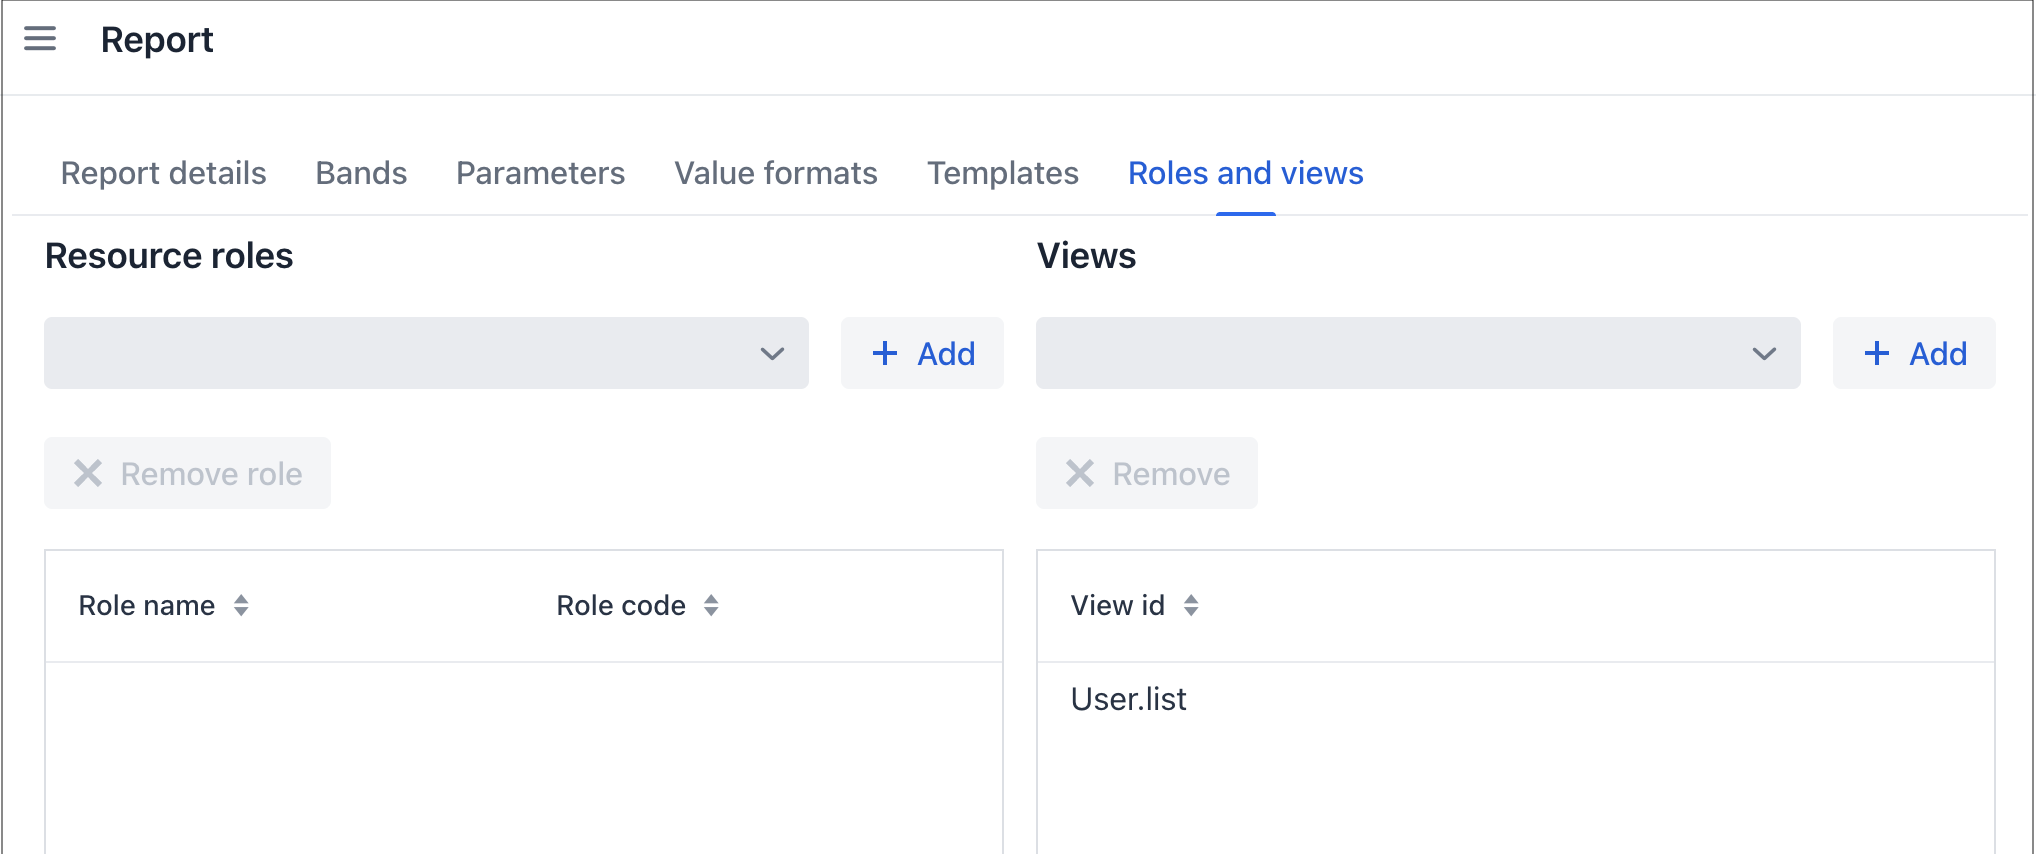
点击 OK 保存报表定义。
在 IDE 中打开
user-list-view.xml,在视图中添加一个类型为report_runListEntityReport的操作以及相应的按钮:src/main/resources/com/company/onboarding/view/user/user-list-view.xml<hbox id="buttonsPanel" classNames="buttons-panel"> <!-- ... --> <button action="usersDataGrid.runListEntityReport"/> </hbox> <dataGrid id="usersDataGrid" width="100%" minHeight="20em" dataContainer="usersDc"> <actions> <!-- ... --> <action id="runListEntityReport" type="report_runListEntityReport"/>确保视图完成了热部署(或者也可以重启应用程序)。打开 Users 视图,在表格中选择一个用户并点击 Print reports 按钮。关于该用户的报表会自动生成并下载。
设计时创建报表
在本节中,我们将在 Studio 中创建 List of Users 报表。报表定义和模板将存储在应用程序源代码中。
| Studio 中的向导目前无法像 运行时向导 那样能配置所创建报表的结构和字段。只是创建一个能显示用户和角色的示例,与报表的调用方式无关。 |
-
在 Jmix 工具窗口中,点击 New (+) → Report Definition。在 New Report Definition 向导的第一步中的 Class Name 字段中输入
ListOfUsers: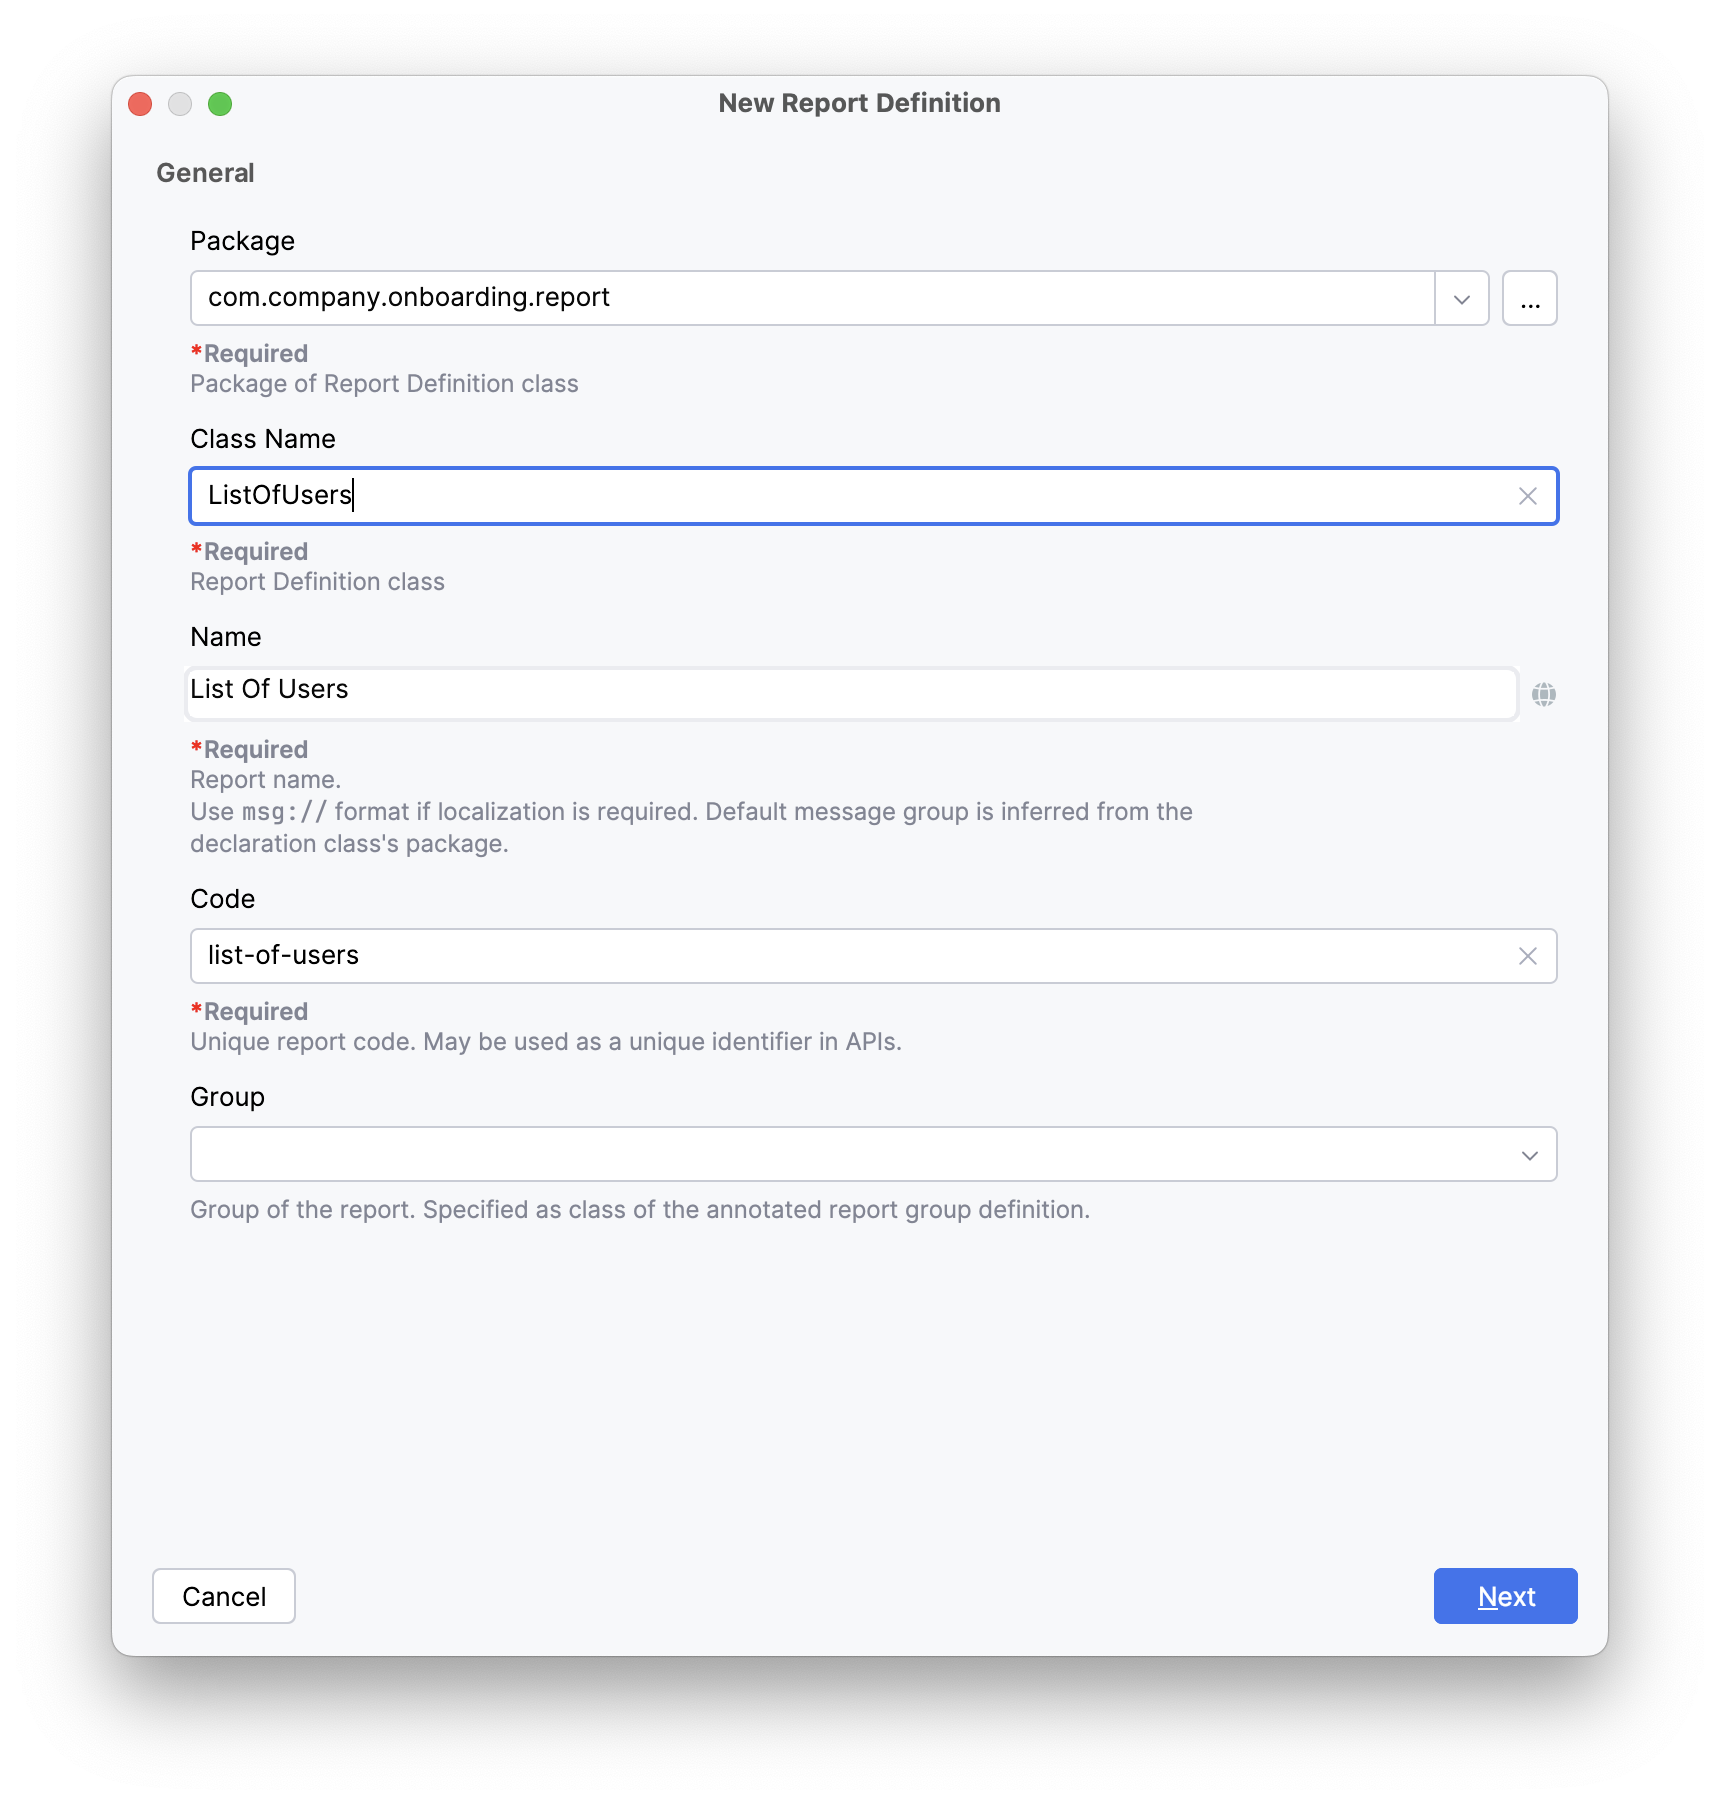
-
在 Additional Parameters 步骤中,所有字段都留空,而 Generate code and template for printing the list of users and their roles(生成打印用户和角色的代码和模板) 需要勾选:

-
在向导的 Availability 步骤中,将
UserListView添加到 Available in Views 列表中: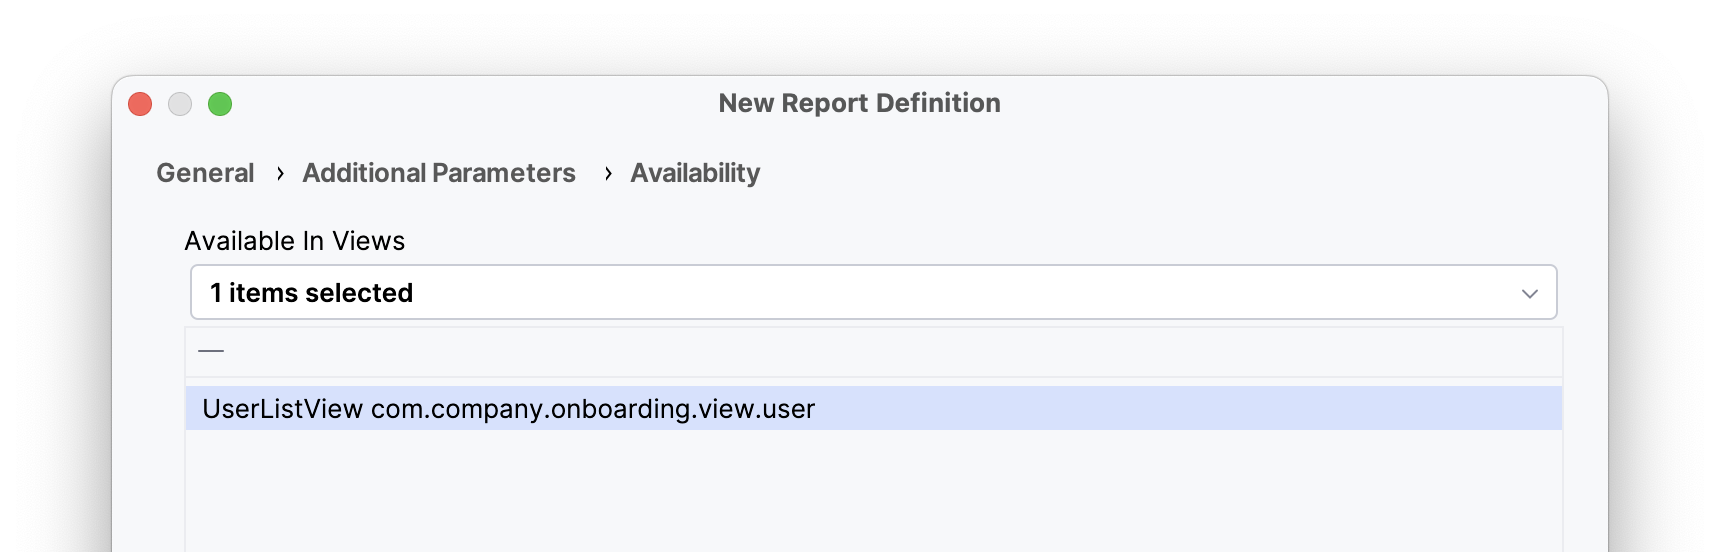
-
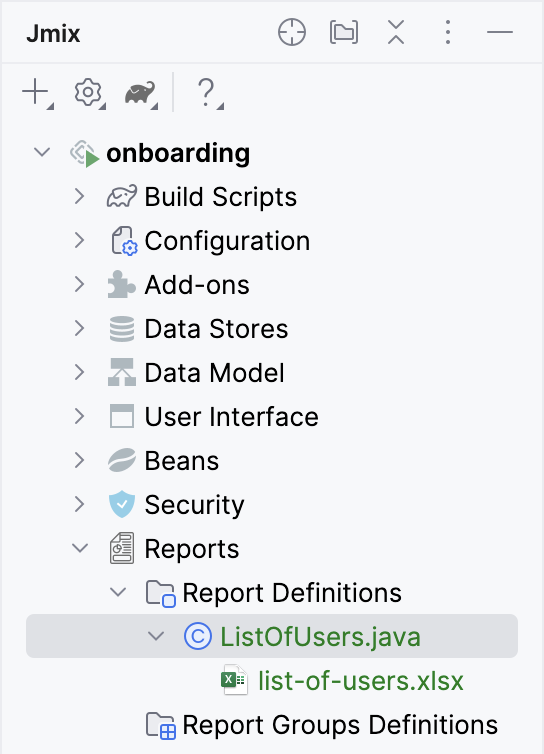
完成向导后,创建的报表类和模板可在 Jmix 工具窗口的 Report Definitions 部分中找到:
报表类使用注解定义报表结构,并包含一个加载用户列表的方法。嵌套的
Roles带区使用 SQL 选择用户角色。src/main/java/com/company/onboarding/report/ListOfUsers.javapackage com.company.onboarding.report; import com.company.onboarding.entity.User; import com.company.onboarding.view.user.UserListView; import io.jmix.core.DataManager; import io.jmix.core.Sort; import io.jmix.core.querycondition.PropertyCondition; import io.jmix.reports.annotation.*; import io.jmix.reports.entity.DataSetType; import io.jmix.reports.entity.ParameterType; import io.jmix.reports.entity.ReportOutputType; import io.jmix.reports.yarg.loaders.ReportDataLoader; import java.util.HashMap; import java.util.List; import java.util.Map; @ReportDef( code = "list-of-users", name = "List Of Users" ) @AvailableInViews(viewClasses = UserListView.class) @TemplateDef( isDefault = true, code = "DEFAULT", filePath = "com/company/onboarding/report/list-of-users.xlsx", outputType = ReportOutputType.XLSX, outputNamePattern = "list-of-users.xlsx" ) // >>> begin example code @InputParameterDef( alias = "username", name = "Username contains (leave empty to select all)", type = ParameterType.TEXT ) @BandDef( name = "Root", root = true ) @BandDef( name = "Header", parent = "Root" ) @BandDef( name = "Users", parent = "Root", dataSets = @DataSetDef( name = "users", type = DataSetType.DELEGATE ) ) @BandDef( name = "Roles", parent = "Users", dataSets = @DataSetDef( name = "roles", type = DataSetType.SQL, query = """ select ra.role_code as "role", ra.role_type as "type" from sec_role_assignment ra where ra.username = ${Users.username}""" ) ) // <<< end example code public class ListOfUsers { private final DataManager dataManager; public ListOfUsers(DataManager dataManager) { this.dataManager = dataManager; } // >>> begin example code @DataSetDelegate(name = "users") public ReportDataLoader usersDataLoader() { return (reportQuery, parentBand, params) -> { List<User> users = dataManager.load(User.class) .condition(PropertyCondition.contains("username", params.get("username")).skipNullOrEmpty()) .sort(Sort.by("username")) .list(); return users.stream() .map(user -> { Map<String, Object> map = new HashMap<>(); map.put("username", user.getUsername()); map.put("firstName", user.getFirstName()); map.put("lastName", user.getLastName()); return map; }) .toList(); }; } // <<< end example code } -
现在可以从 Reports 和 Run report 视图中运行报表了。
-
如需从 Users 视图运行报表,打开
user-list-view.xml,在视图中添加一个类型为report_runReport的操作以及相应的按钮:src/main/resources/com/company/onboarding/view/user/user-list-view.xml<hbox id="buttonsPanel" classNames="buttons-panel"> <!-- ... --> <button action="usersDataGrid.runReport"/> </hbox> <dataGrid id="usersDataGrid" width="100%" minHeight="20em" dataContainer="usersDc"> <actions> <!-- ... --> <action id="runReport" type="report_runReport"/>确保视图完成了热部署(或者也可以重启应用程序)。打开 Users 视图,并点击 Print reports 按钮。可以看到 Run report 对话框。
