高密度数据可视化
高密度数据是一种在特定空间或时间区域内具有大量数据点的数据集。
数量多且密集的数据集可能难以进行有效的可视化。但是,有几种方法可以使得高密度数据的展示更容易,且能表现数据的意义。以下各小节将讨论这些方法。
聚合图
Clustering(聚合图)是一种根据图层中 地图要素 之间的接近程度对要素进行分组显示的方法。通常,每个聚合图标的大小与其包含的要素数量成正比。这种方法可以用于显示区域中点的距离非常近的数据。
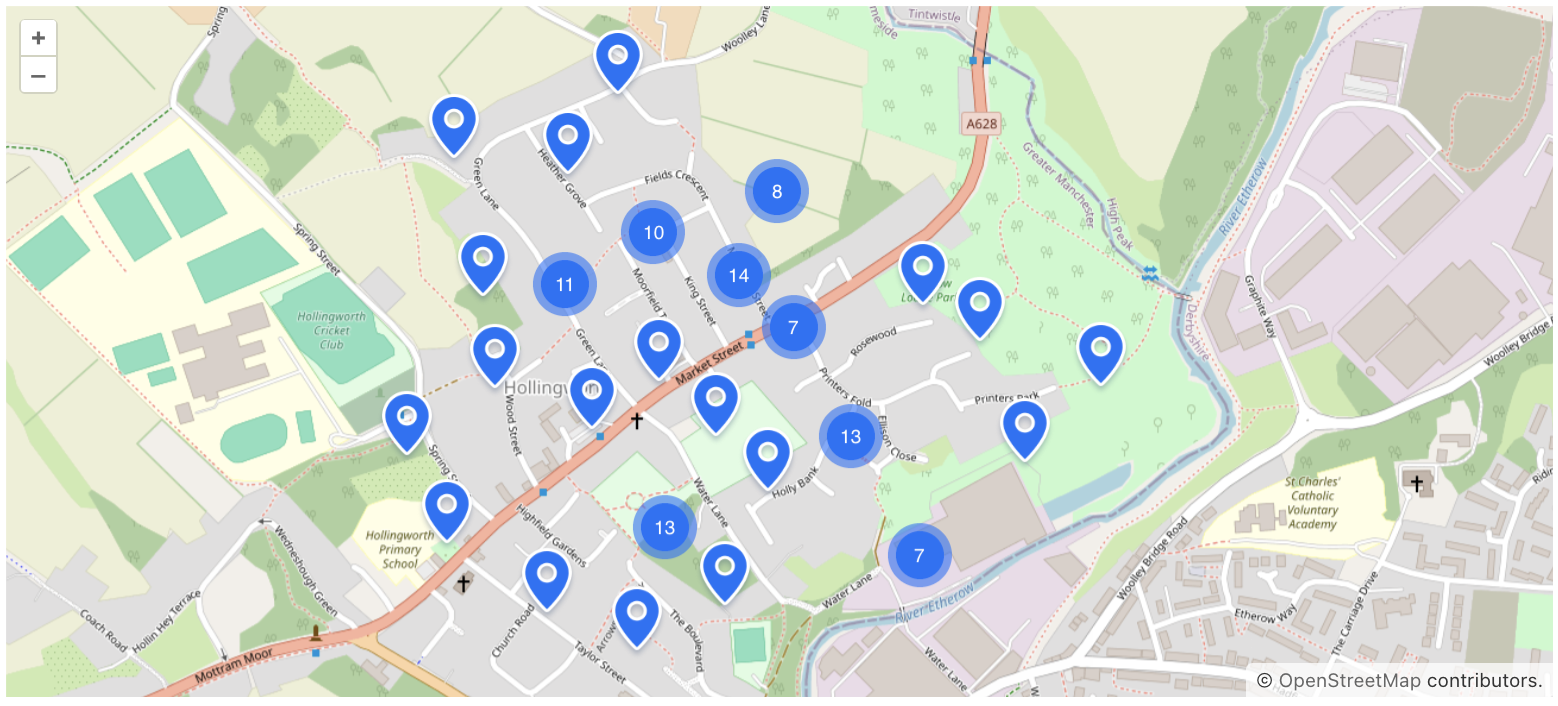
聚合在 矢量层 中的 cluster source(聚合源)配置。聚合源需要使用 DataVectorSource 或 VectorSource。
按照下面步骤可以对在 XML 对数据源进行聚合处理:
-
在 geoMap 组件添加一个矢量层。
-
为矢量层添加
ClusterSource。 -
按下面的代码配置
DataVectorSource:<maps:geoMap id="geoMap" width="100%" height="100%"> <maps:layers> <maps:tile> <maps:osmSource/> </maps:tile> <maps:vector id="vectorLayer"> <maps:cluster> <maps:dataVectorSource dataContainer="locationsDc" property="building"/> </maps:cluster> </maps:vector> </maps:layers> </maps:geoMap>
接下来,我们将介绍聚合图的几个关键概念。
聚合源
ClusterSource 聚合源是一个支持地图要素聚合的数据源。需要额外的源支持地图要素,额外的源可以是下列之一:
-
DataVectorSource -
VectorSource
其中 VectorSource 可用于无需绑定数据的要素聚合:
<maps:geoMap id="map"
             width="100%"
             height="100%">
    <maps:layers>
        <maps:tile>
            <maps:osmSource/>
        </maps:tile>
        <maps:vector id="vector">
            <maps:cluster>
                <maps:vectorSource/>
            </maps:cluster>
        </maps:vector>
    </maps:layers>
</maps:geoMap>
cluster 属性
cluster 元素有下列属性:
-
attributions表示制作人的名称。 -
disableAtZoom设置一个缩放级别,在该级别上将禁用聚合。 -
distance表示地图要素可以聚合在一起的距离(以像素为单位)。 -
minDistance表示聚合之间的最小像素距离。(有关详细信息,请参阅 OSM 文档)。 -
showSinglePointAsCluster将单个点显示为大小为 1 的聚合。 -
weightProperty- 如果提供,图层中的每个点都将有一个基于 geo-object 的weight属性的整数权重值。此值用于计算组合的聚合值(默认情况下,聚合值为内部点的数量)。 -
wrapX设置文字是否可以水平换行。
权重属性
默认情况下,一个聚合会计算其中包含点的数量,然后将数量显示在聚合图的标记上。通过 weightProperty 可以设置用于聚合计算的属性。
例如,该项目包含一个 JPA 实体:
@JmixEntity
@Table(name = "LOCATION")
@Entity
public class Location {

    @Column(name = "BUILDING")
    private Point building; (1)

    @Column(name = "WEIGHT")
    private Integer weight; (2)

    // getters and setters
}| 1 | building 属性包含建筑物在地图上的坐标。 |
| 2 | weight 属性包含建筑物的一个数值属性。 |
XML 中,我们按如下配置聚合:
<data>
    <collection id="locationsDc" class="com.company.mapssample.entity.Location">
        <loader id="locationsDl" readOnly="true">
            <query>
                <![CDATA[select e from Location e]]>
            </query>
        </loader>
        <fetchPlan extends="_base"/>
    </collection>
</data>
<facets>
    <dataLoadCoordinator auto="true"/>
</facets>
<layout>
    <maps:geoMap id="locationsMap"
                 width="100%"
                 height="100%">
        <maps:layers>
            <maps:tile>
                <maps:osmSource/>
            </maps:tile>
            <maps:vector id="vectorL">
                <maps:cluster weightProperty="weight">
                    <maps:dataVectorSource dataContainer="locationsDc"
                                           property="building"/>
                </maps:cluster>
            </maps:vector>
        </maps:layers>
    </maps:geoMap>
</layout>
聚合图标样式
聚合图的图标可以通过 Java API 进行自定义。有两种方式:
-
添加一个新的样式盖住默认样式。
@ViewComponent("locationMap.vectorLr.cluster")
public ClusterSource cluster;

@Subscribe
public void onInit(final InitEvent event) {
    cluster.addPointStyles(new Style()
            .withImage(new CircleStyle()
                    .withRadius(15)
                    .withFill(new Fill("#7F70D8"))));
}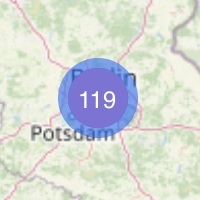
-
删除默认样式并添加新样式。
@ViewComponent("styledMap.vectLr.clusterS")
public ClusterSource clusterS;

@Subscribe
public void onInit(final InitEvent event) {
    clusterS.removeAllPointStyles();
    clusterS.addPointStyles(
            new Style()
                    .withImage(new CircleStyle()
                            .withRadius(20)
                            .withFill(new Fill("rgba(163, 104, 213, 0.6)"))),
            new Style()
                    .withImage(new CircleStyle()
                            .withRadius(15)
                            .withFill(new Fill("rgba(144, 64, 213, 1)"))));
}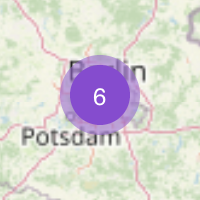
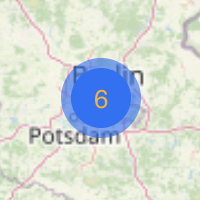
如需修改文字样式,使用 setPointTextStyle() 方法:
@ViewComponent("textStyleMap.vctLayer.clusterSource")
public ClusterSource clusterSource;

@Subscribe
public void onInit(final InitEvent event) {
    clusterSource.setPointTextStyle(new Style()
            .withText(new TextStyle()
                    .withFont("13px sans-serif")
                    .withOffsetY(1)
                    .withFill(new Fill("#FAAF22"))));
}
设置要素属性
要素中可以定义将在聚合中使用的要素属性。
例如,如果聚合指定了权重属性,那么将会尝试从要素的属性中获取。
示例:
<maps:geoMap id="featuresMap"
             height="100%"
             width="100%">
    <maps:layers>
        <maps:tile>
            <maps:osmSource/>
        </maps:tile>
        <maps:vector id="pointsLayer">
            <maps:cluster id="pointClusterSource"
                          weightProperty="weight" >
                <maps:vectorSource id="source"/>
            </maps:cluster>
        </maps:vector>
    </maps:layers>
</maps:geoMap>
@ViewComponent("featuresMap.pointsLayer.pointClusterSource.source")
public VectorSource source;
@Subscribe
public void onInit(final InitEvent event) {
source.addAllFeatures(generatePoints());
}
private List<Feature> generatePoints() {
List<Feature> features = new ArrayList<>(10000);
int e = 45;
for (int i = 0; i < 10000; i++) {
Point point = GeometryUtils.createPoint(2 * e * Math.random(),
2 * e * Math.random() - e);
features.add(
new PointFeature(point)
.withProperty("weight",
Double.valueOf(Math.random() * 10).intValue()));
}
return Collections.unmodifiableList(features);
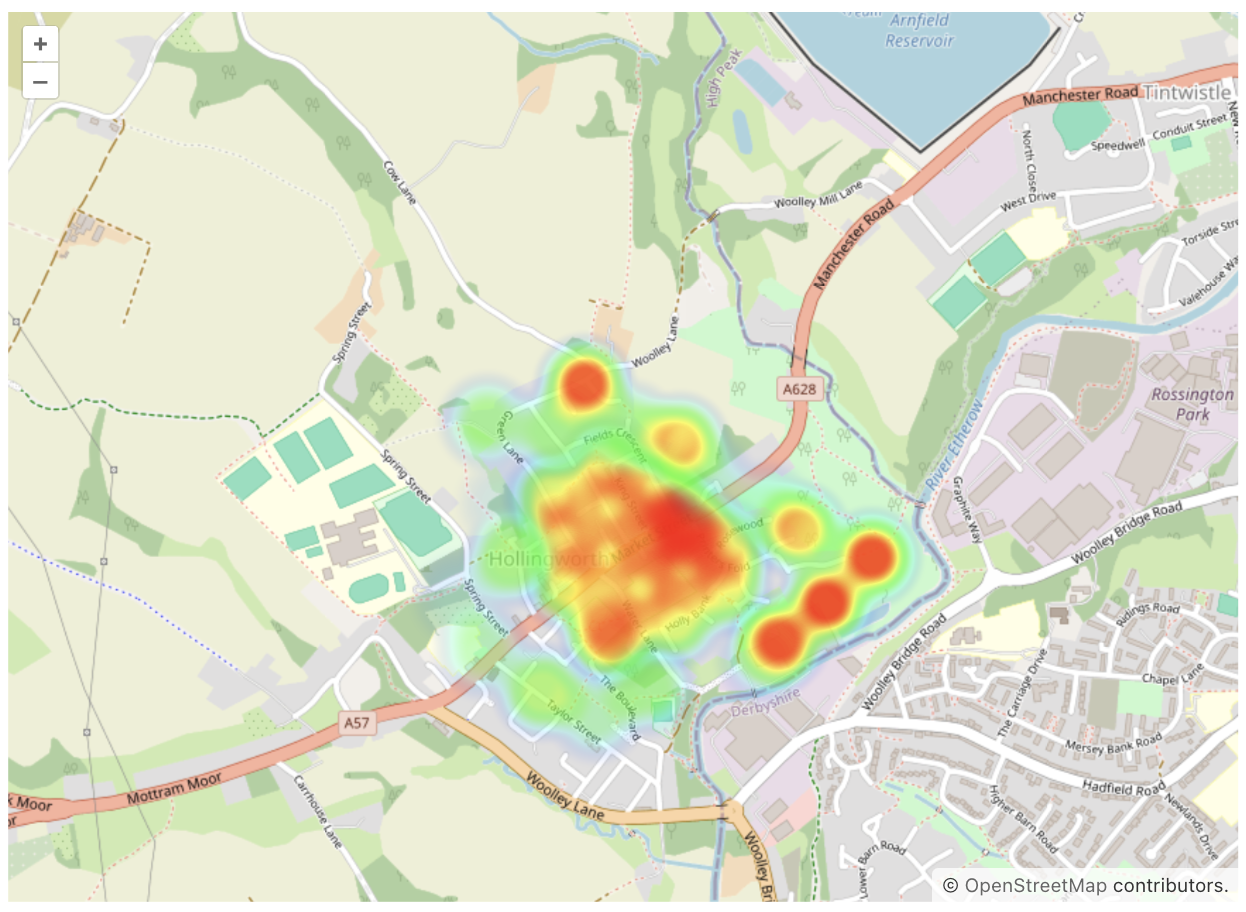
}热力图
Heatmap(热力图)将 点要素 渲染为栅格层,使用渐变色依次显示点的浓度。
较暖的颜色(如红色或橙色)表示值较高的区域,而较冷的颜色(如蓝色或绿色)表示值较低的区域。
热力图在 HeatmapLayer 配置。该图层以热点的形式显示数据。HeatmapLayer 使用 HeatmapDataVectorSource 和 VectorSource。
-
HeatmapDataVectorSource用于绑定 数据容器(实体或 DTO)。property属性需配置为Point类型的实体属性。 -
当不需要与数据容器绑定时,应使用
VectorSource。
例如,可以按下列步骤配置一个与数据容器关联的热力图:
-
为 geoMap 组件添加热力图层:在 Jmix UI 结构或视图 XML 中,选择
geoMap元素,然后点击属性面板的 Add 按钮,选择 Layers → HeatmapLayer。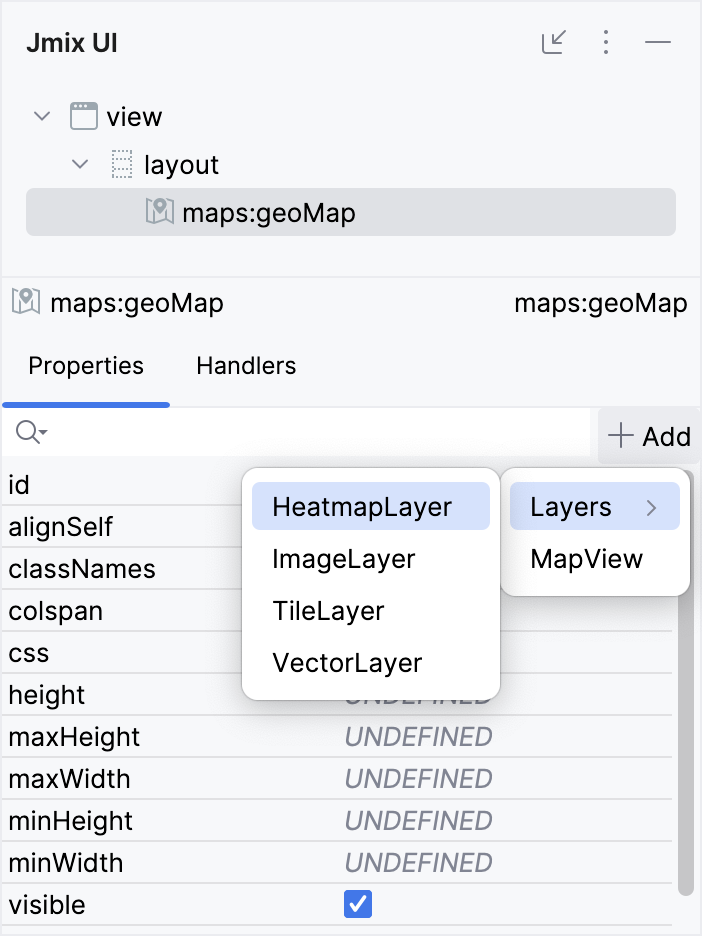
-
为热力图层添加
HeatmapDataVectorSource,按下面的代码配置:<data> <collection id="locationsDc" class="com.company.mapssample.entity.Location"> <loader id="locationsDl" readOnly="true"> <query> <![CDATA[select e from Location e]]> </query> </loader> <fetchPlan extends="_base"/> </collection> </data> <layout> <maps:geoMap id="defaultMap" width="100%" height="100%"> <maps:layers> <maps:tile> <maps:osmSource/> </maps:tile> <maps:heatmap blur="20" radius="15"> <maps:heatmapDataVectorSource dataContainer="locationsDc" property="building"/> (1) </maps:heatmap> </maps:layers> </maps:geoMap> </layout>1 设置为 Location实体中Point类型的属性
接下来,我们将介绍热力图的几个关键概念。
热力图属性
heatmap 具有下列属性:
-
weightProperty 属性设置为实体(或要素)中表示权重(强度)的属性。
如果未指定该属性,则将使用最大可用权重值。 -
maxWeight- 表示最大权重值,范围从0.0到1.0。 -
blur设置点模糊效果的像素大小。 -
radius设置点半径的像素大小。 -
gradient- 配置渐变色范围,需设置为逗号分隔的 CSS 颜色。
此外,还包括基本的图层属性:className、maxZoom、minZoom、opacity、visible、zIndex。
示例:
<maps:heatmap weightProperty="intensity"
              maxWeight="0.5"
              blur="20"
              radius="20"
              gradient="#32CD32, #00FF00, #7CFC00, #7FFF00, #ADFF2F">
    <maps:heatmapDataVectorSource dataContainer="locationsDc"
                                  property="building"/>
</maps:heatmap>
权重属性
weightProperty 是确定热图上点的强度或权重的属性。需指定为要素或者实体的属性。此属性必须是 Double 类型,且值域为 0.0 到 1.0。
如果未显式定义 weightProperty 的值,则通常使用默认值 1 来表示热力图点的最大权重。
示例
无数据绑定的热力图
如无需绑定数据容器,则可以使用 VectorSource。
下面的示例中,用 XML 配置并初始化了一个地图。
<maps:geoMap id="map"
             width="100%"
             height="100%">
    <maps:layers>
        <maps:tile>
            <maps:osmSource/>
        </maps:tile>
        <maps:heatmap id="heatmap"
                      blur="10"
                      radius="15"
                      weightProperty="weight"> (1)
            <maps:vectorSource id="vectorSource"/> (2)
        </maps:heatmap>
    </maps:layers>
</maps:geoMap>| 1 | 设置地图要素中将使用的属性。 |
| 2 | 为矢量源设置一个 id,以便注入控制器。 |
然后,我们通过 Java 控制器设置其他信息:
@ViewComponent("map.heatmap.vectorSource") (1)
private VectorSource vectorSource;

@Subscribe
public void onInit(final InitEvent event) {
    PointFeature feature = new PointFeature(GeometryUtils.createPoint(10, 10));
    feature.withProperty("weight", 1); (2)

    vectorSource.addFeature(feature);
}| 1 | 在控制器类中注入 vectorSource。 |
| 2 | 方法中使用 weight 参数设置值,这个参数是在 XML 中 heatmap 元素指定的。 |
有数据绑定的热力图
例如,项目中有一个 JPA 实体:
@JmixEntity
@Table(name = "LOCATION")
@Entity
public class Location {

    @Column(name = "BUILDING")
    private Point building; (1)

    @Column(name = "INTENSITY")
    private Double intensity; (2)

    // getters and setters
}| 1 | building 属性包含建筑物在地图上的坐标。 |
| 2 | intensity 属性包含建筑物的一个数值属性。 |
XML 中,我们按如下配置热力图:
<data>
    <collection id="locationsDc"
                class="com.company.mapssample.entity.Location">
        <loader id="locationsDl" readOnly="true">
            <query>
                <![CDATA[select e from Location e]]>
            </query>
        </loader>
        <fetchPlan extends="_base"/>
    </collection>
</data>
<layout>
    <maps:geoMap id="geoMap"
                 width="100%"
                 height="100%">
        <maps:layers>
            <maps:tile>
                <maps:osmSource/>
            </maps:tile>
            <maps:heatmap blur="10"
                          radius="15"
                          weightProperty="intensity"> (1)
                <maps:heatmapDataVectorSource dataContainer="locationsDc"
                                              property="building"/>
            </maps:heatmap>
        </maps:layers>
    </maps:geoMap>
</layout>| 1 | 在 weightProperty 属性中指定包含点强度值的实体属性的值。 |
WeightProvider
HeatmapDataVectorSource 提供了一个特殊的方法用于处理实体或 DTO 没有 权重属性 或权重需要通过别的方式计算的情形。此时,不需要指定 weightProperty。
下面的示例中,在 XML 配置并初始化了一个地图。
<maps:geoMap id="locationMap"
             width="100%"
             height="100%">
    <maps:layers>
        <maps:tile>
            <maps:osmSource/>
        </maps:tile>
        <maps:heatmap id="heatmapLayer"
                      weightProperty="intensity"
                      blur="15"
                      radius="20">
            <maps:heatmapDataVectorSource
                    id="heatmapDataVectorSource"
                    dataContainer="locationsDc"
                    property="building"/>
        </maps:heatmap>
    </maps:layers>
</maps:geoMap>
然后,我们在 Java 控制器中为 heatmapDataVectorSource 配置了一个权重的 provider:
@ViewComponent("locationMap.heatmapLayer.heatmapDataVectorSource")
private HeatmapDataVectorSource<Location> heatmapDataVectorSource; (1)

@Subscribe
public void onInit(final InitEvent event) {
    heatmapDataVectorSource.setWeightProvider(location -> { (2)
        int weight = location.getWeight();
        if (weight > 50) {
            return 0.7;
        }
        return 0.3;
    });
}| 1 | 注意:heatmapDataVectorSource 是有泛型参数的。 |
| 2 | 对每一项数据都调用这个 provider 并返回计算出的权重值。 |
